
Mapping and GIS use cases
What’s the job?
135 jobs your AI teammate does, grouped by the work they get done. Each page shows a real result, with the request already written for you.
Decide where to open, close or move
Rank sites and areas, size a market, compare catchments and review a network before you commit.
Mexican fast food in Greater Perth by SA2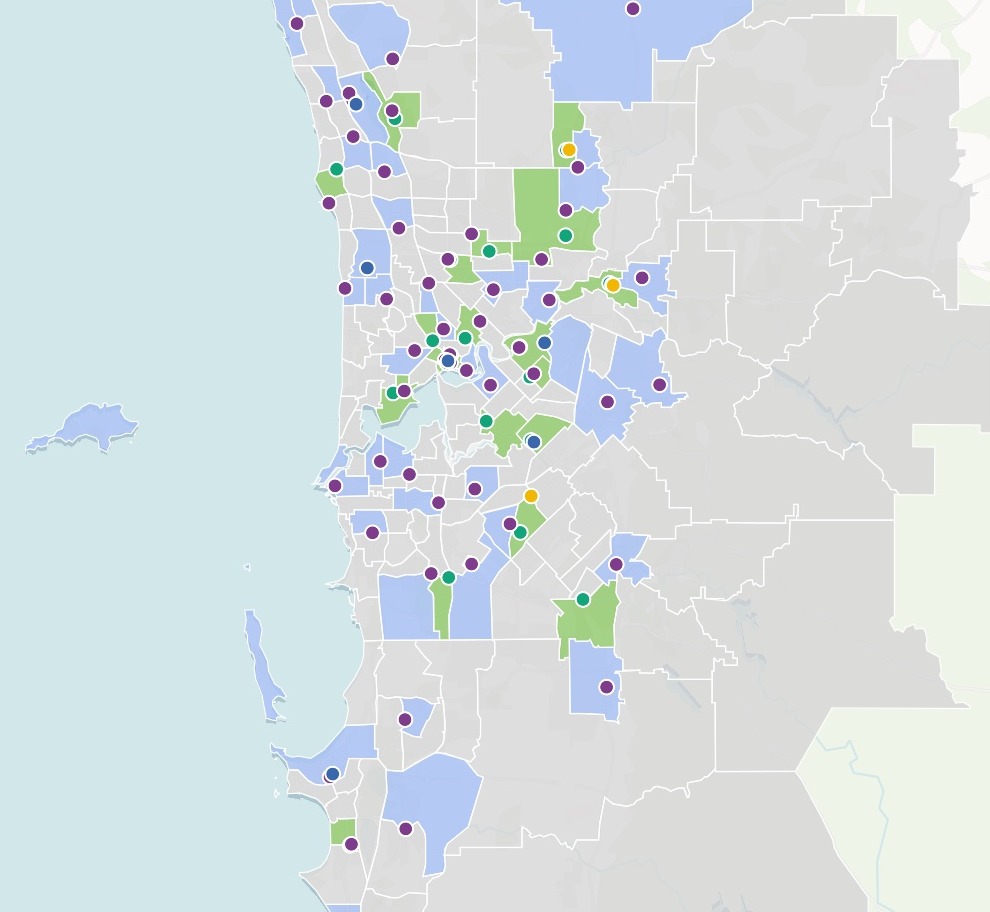
- Compare a shortlist of sites before you signYour candidate sites, set side by side on who lives around them.
- Choose which of your sites reach the most peopleThe best few from your list, and who each one reaches.
- Find where there is room for more storesThe gap between demand and the stores you have.
- Find the places most like your best onesEvery district ranked by how alike it is to your best.
- Decide which branches to closeDeposits, people, rivals and the next branch, side by side.
- Review the locations of a chain before a bidEvery shop, its residents and rivals, and room to grow.
- Find the neighbourhoods your lending is missingLoan share by tract income against the homes, and the tracts with no loans mapped.
- Compare places by what is within a walkShortlisted sites side by side: what is nearby, and the nearest of each.
- See how much two sites shareThe overlap between two catchments, and what a third would take.
Know your customers and your market
Where your customers and likely customers are, what the areas around them hold, and how each region is doing.
Pima County: Population Aged 65 and Over by Census Tract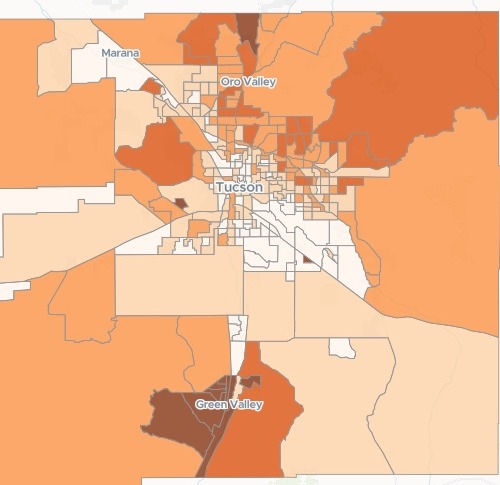
- Map where the people you want to reach liveHow many in each area, and what share, from the census.
- Add area facts to every row of a customer listCensus income, age and household size, by address.
- See where your customers cluster, area by areaRecords counted into each neighbourhood, the busiest and quietest named.
- Compare footfall between two periods, counter by counterWhich streets are up and which are down, from your own counts.
- See which brand leads in every areaEvery shop of each brand, counted area by area.
- Map your results by area against targetEach area’s rate, the change from last year, and the weak ones picked out.
- Build a prospect list of every business of one kindEvery business of a type in your area, as a list and a map.
See who you reach and who is left out
Drive times, walking access, response cover and coverage gaps: who a service reaches, and who it misses.
Denver Fire: 4-minute drive coverage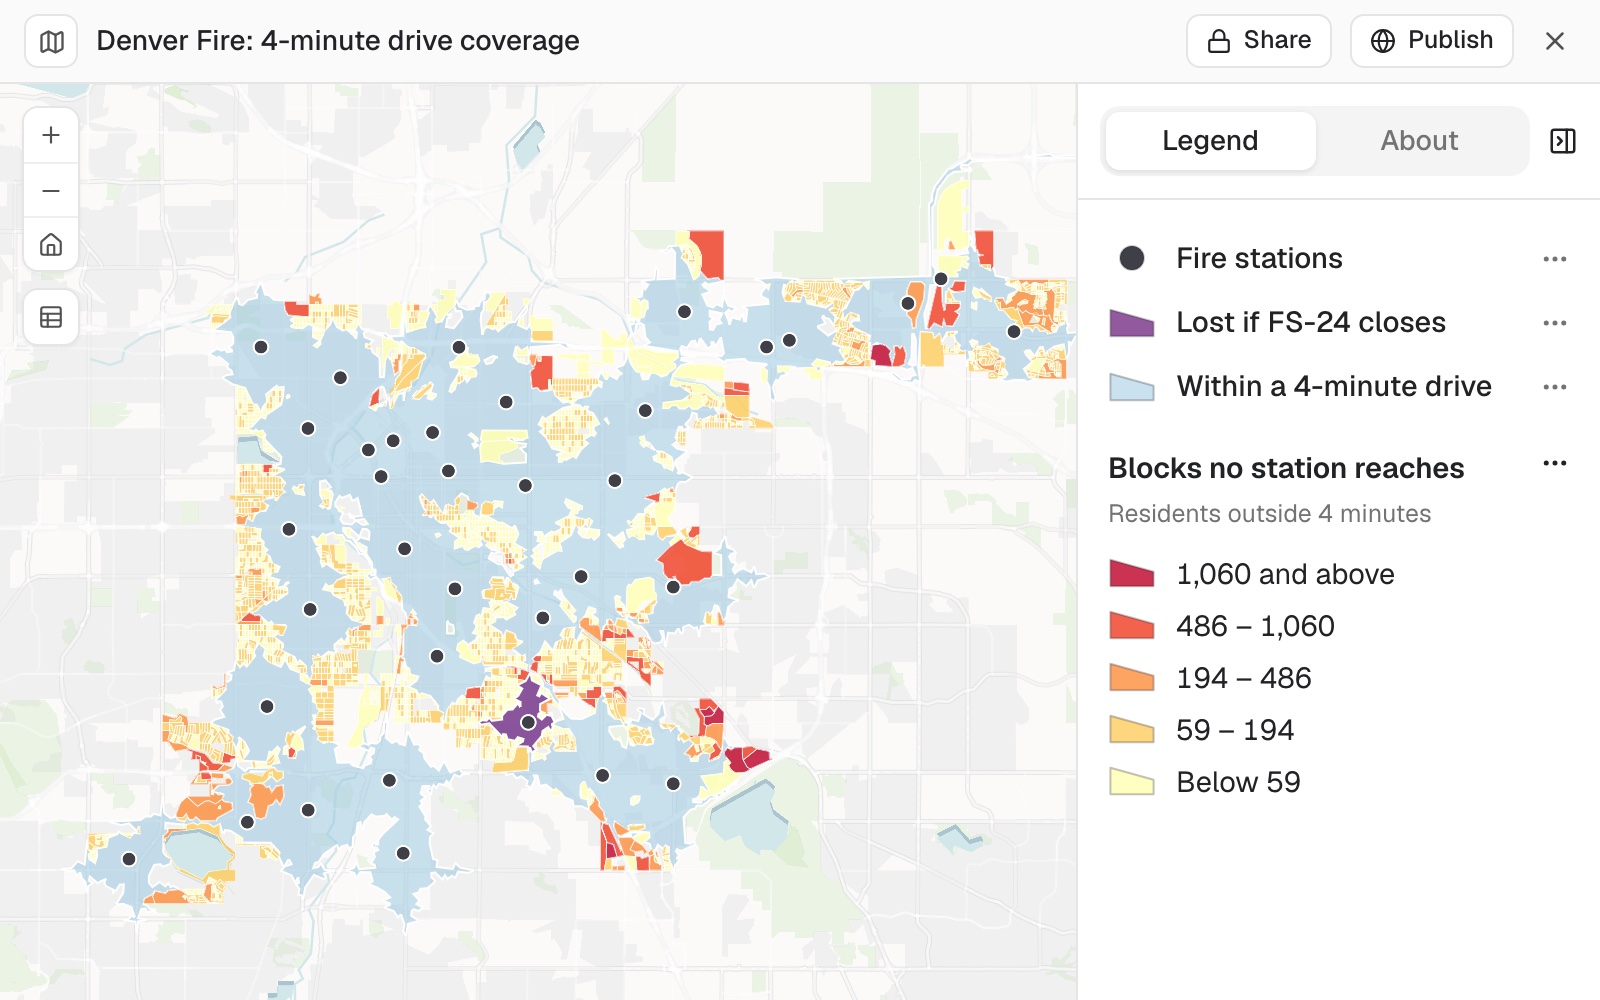
- See who and what is within reach of a siteHouseholds and competitors in each drive time.
- Find what is nearest each of your sites, by roadThe nearest one to each, the distance, and those beyond your limit.
- Find who lives too far from a serviceThe areas beyond the walk, and who there has no car.
- Find what share of residents can walk to a stopWalking access to a service, area by area.
- Score every tract by what people can walk toSeven kinds of everyday place, a 15-minute walk, a score for every tract.
- See how much of your city each station reaches in timeDrive-time coverage, and the residents inside and outside.
- Find the areas a service has not reachedCoverage by area, and the gap left after planned build.
- Check who is in the catchment, and how far each walksWalking distance by the path network, pupil by pupil.
- Rank schools by the crashes around themCollisions near each school, the hot spots, and a crossing check for each.
- Check which addresses fall inside your areaInside or outside on every row of your list, counted and mapped.
- Plan a leaflet drop to the homes near your shopHouseholds in each postcode district within a drive, as a spreadsheet and a map.
Divide the ground between people
Territories, turf and districts drawn fairly, for sales reps, field teams, volunteers and voters.
Texas veterinary clinics by sales territory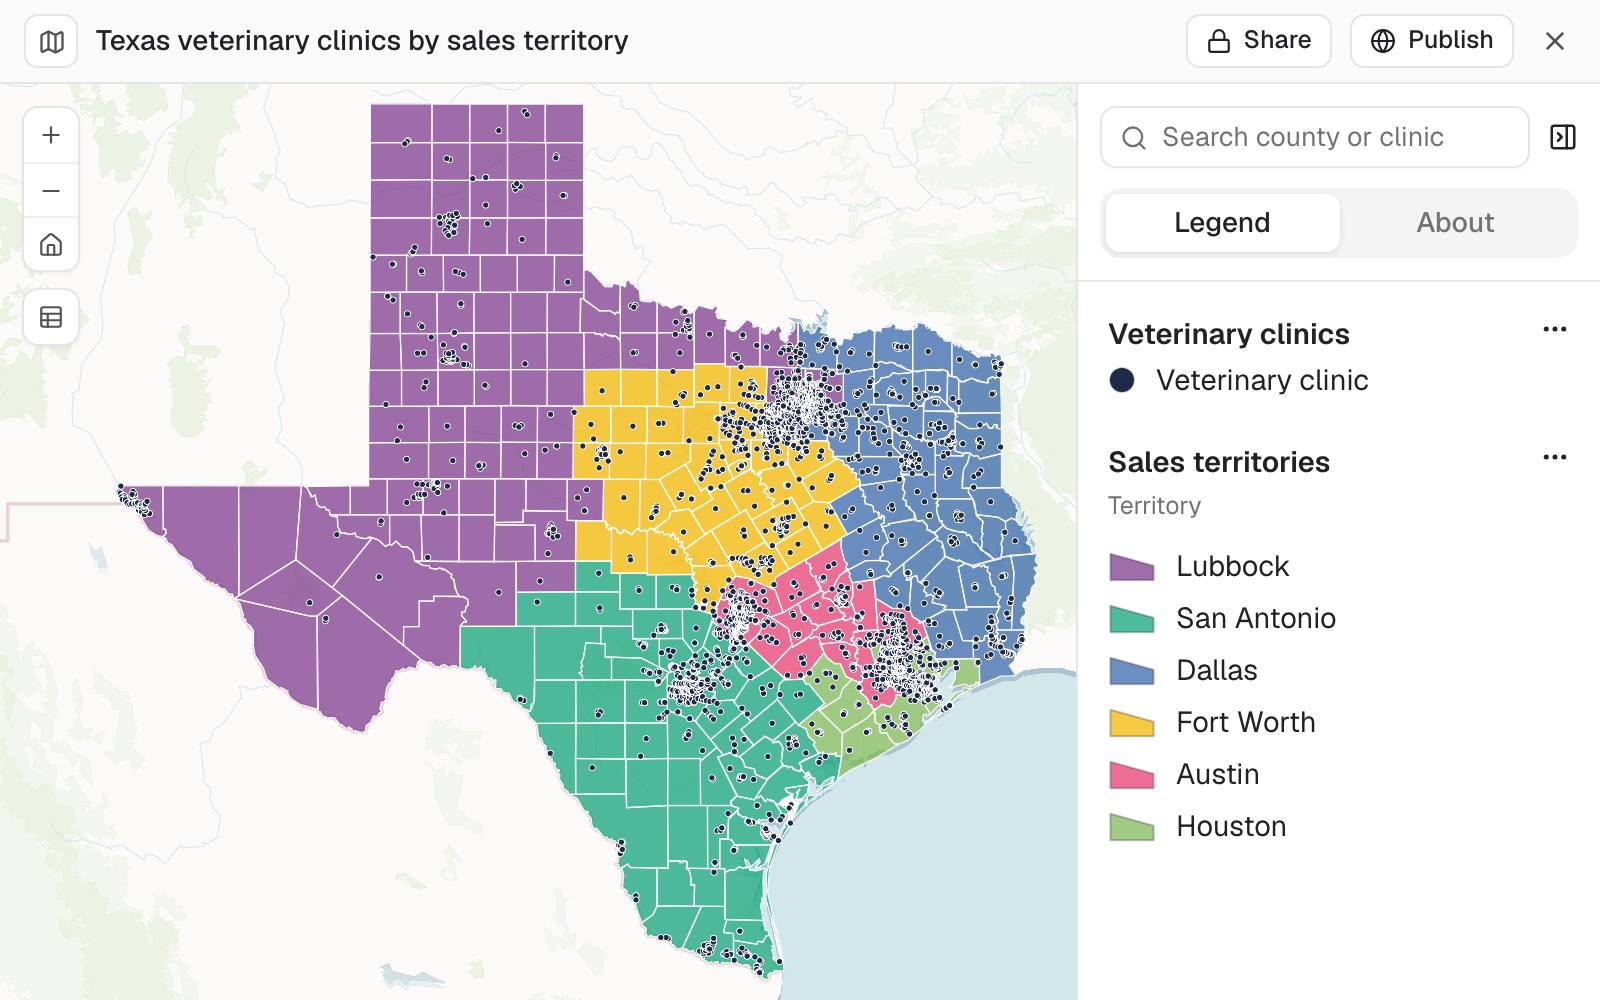
- Split accounts into fair sales territoriesEven territories from your account list, drawn on a map.
- Find the accounts no rep reaches, and test a moveDrive-time patches, the gaps and overlaps, and what one change would do.
- Give a new rep a map of their patchEvery account on the districts they cover, a tap from its address.
- Draw a franchise territory and count what it holdsZIP codes as one protected area, its households against your standard.
- Split addresses into canvass turfsDoor-knocking patches of the size you ask, each with a walk list.
- Test your districts against the censusHow far each district sits from an equal share, and a balanced test plan to compare.
- Plan relief deliveries and track who is still waitingStops shared between trucks, timed, and a map coloured by who has been reached.
Put your own records on a map
Your list of sites, incidents, grants or results, mapped so the pattern in it shows.
Pretzel Hatch sites by format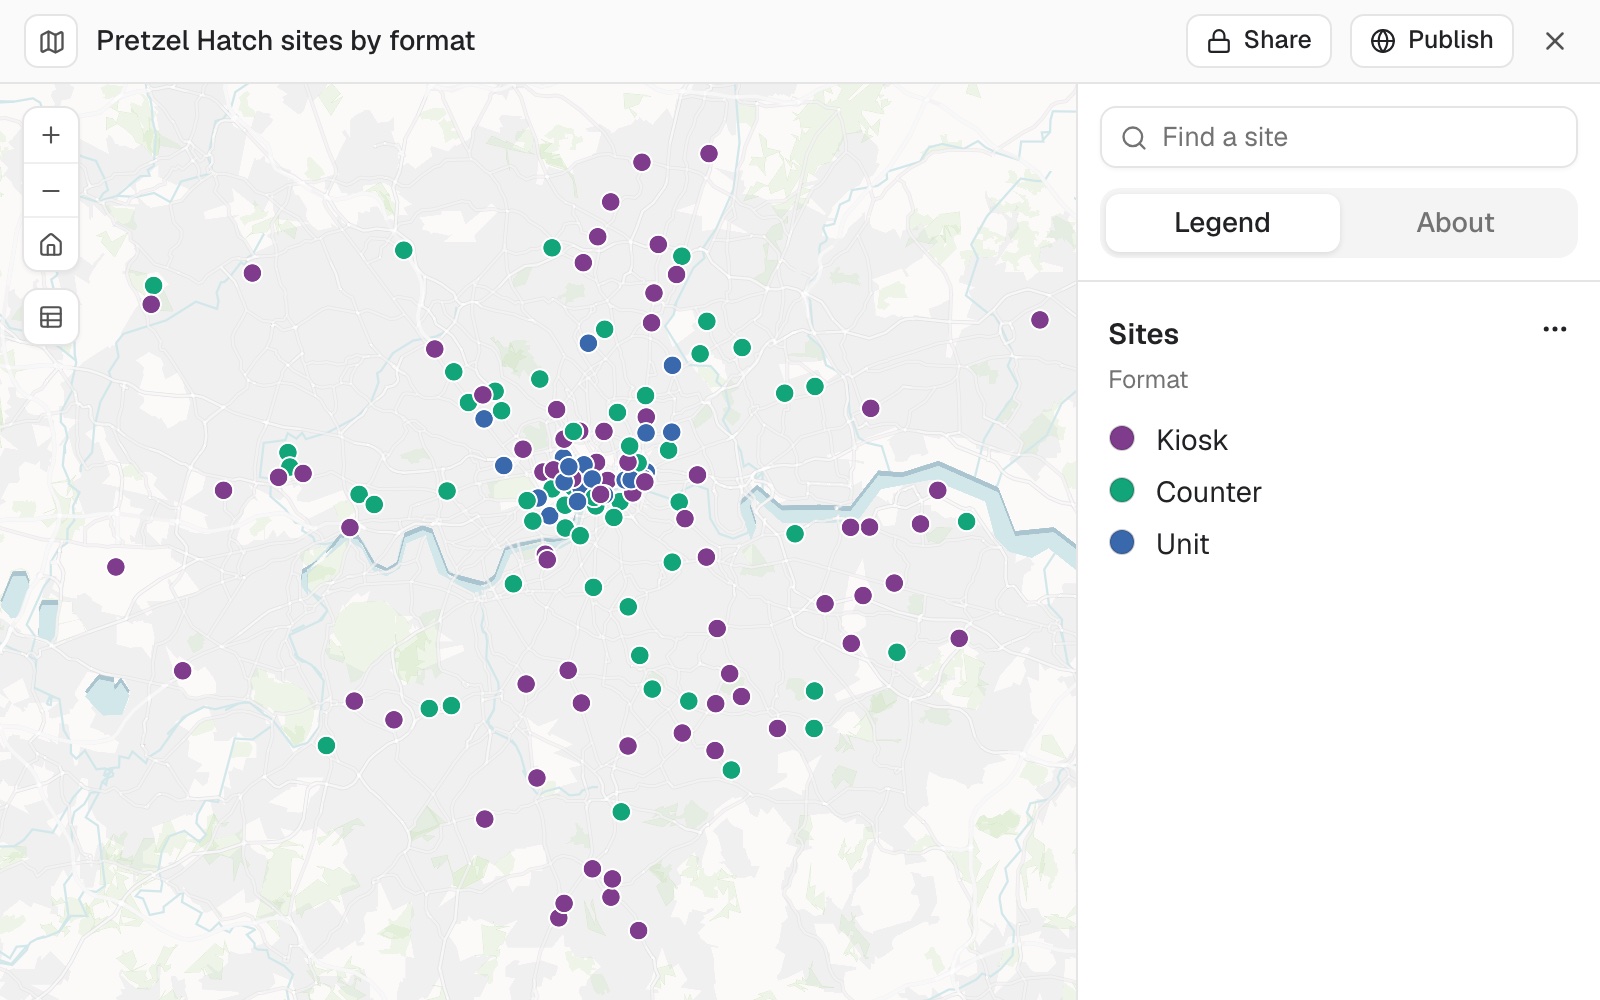
- Turn an address list into a shared mapFrom a spreadsheet of addresses to a link your team can open.
- Join a table of figures to area boundariesYour figures, on the shapes they belong to.
- Map a log of incidents and count them by areaEvery record placed, counted by area and by type.
- Map every building you hold, and the leases coming dueOwned and leased on one map, by when each lease ends.
- Give your team one map of the whole operationEvery site by its rating, and the areas that need you first.
- See which of your suppliers a storm reachedEvery factory in its strongest wind zone, with the workers in each.
- Show where the money went, per headTotals by area, divided by population, ranked and mapped.
- Map election results seat by seatWho won, the majority and turnout, as views readers switch between.
- Map an official statistic, area by areaA published figure for every small area, shaded by its value.
- See how full every parking block isOccupancy by block face and rate period, with an up, down or stay call.
Find the pattern in the data
Hot spots, trends, movements and scores: the pattern in your records, found and shown.
Leeds burglary hot spots and incidents (September 2026)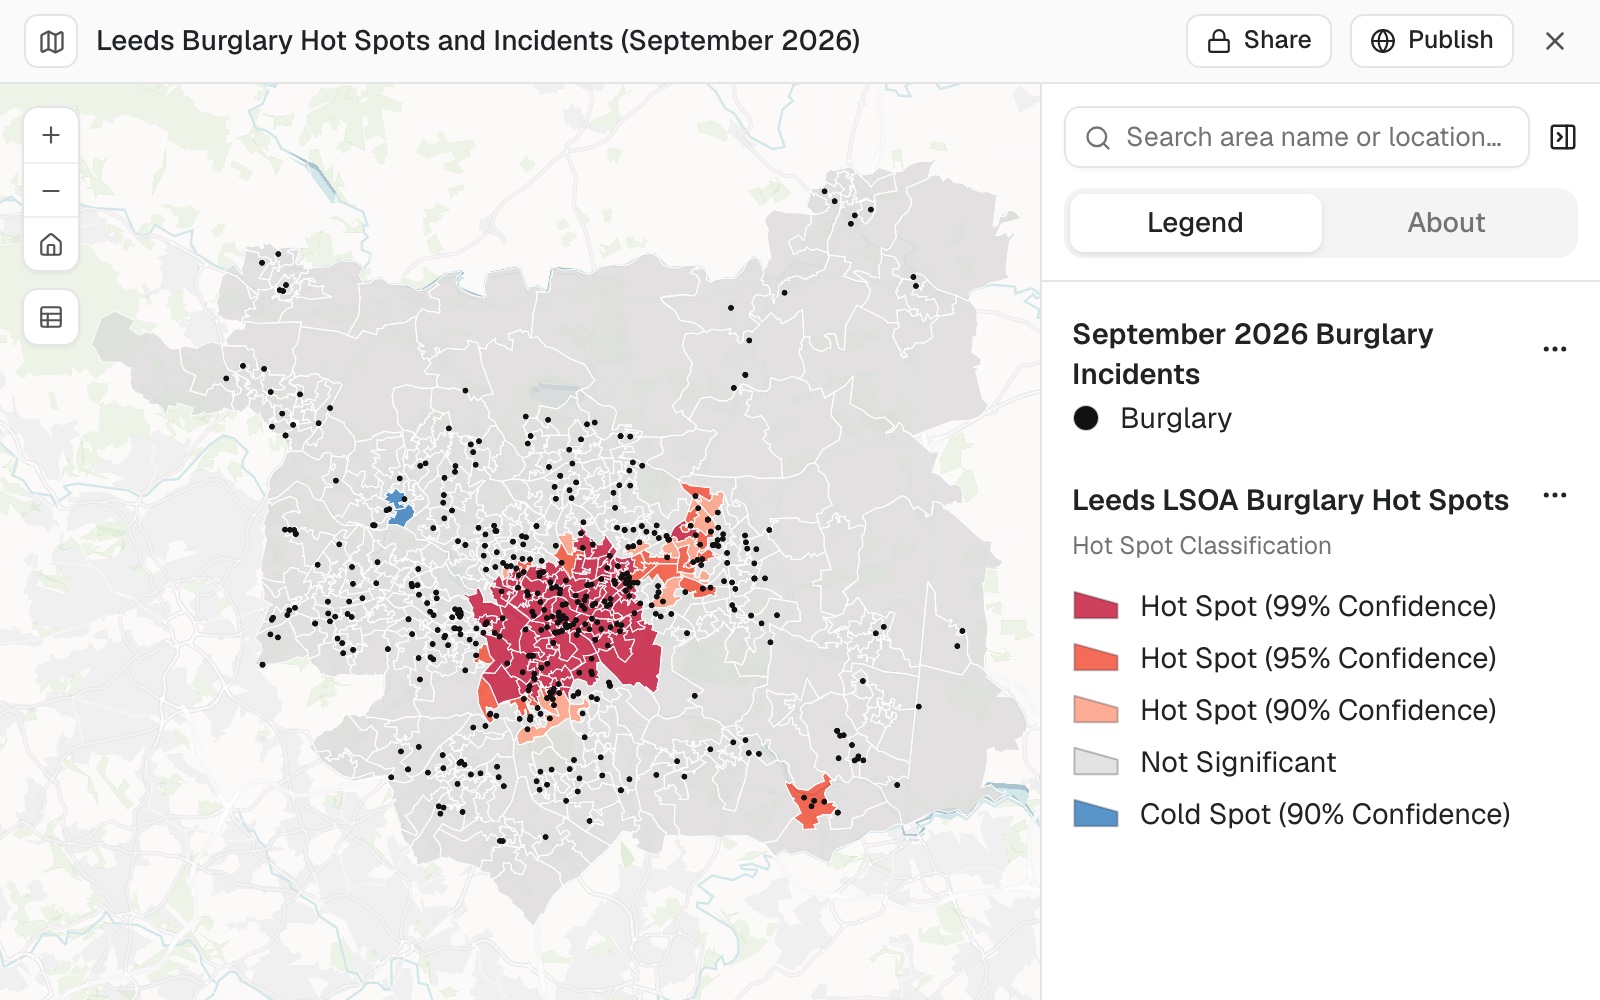
- Find where incidents really clusterHot spots tested, not just counted.
- See when and where incidents happenThe worst hours, days and months, and hot spots by time of day.
- Map how a figure changed, area by areaThe change between two years, ranked both ways, with the break at zero.
- Combine several measures into one score per areaA weighted score, ranked and mapped, with the method written down.
- See how two measures go together, area by areaHow strongly they move together, a map of both at once, and the areas that break the pattern.
- Find the claims worth a closer lookOut-of-town bills and shared mailing addresses, mapped for review.
- Map where people commute, county to countyA line for every flow, the biggest ranked, and each county’s net commuting.
- Play back a day of vessel traffic on a mapEach vessel’s track, a time slider in local time, and what each one did.
- Estimate a value everywhere from a few readingsKriging, with the uncertainty mapped.
Know what is at risk
Which sites, homes and people sit in a hazard’s way, how much is exposed, and what to do first.
York open schools in flood zones 2 and 3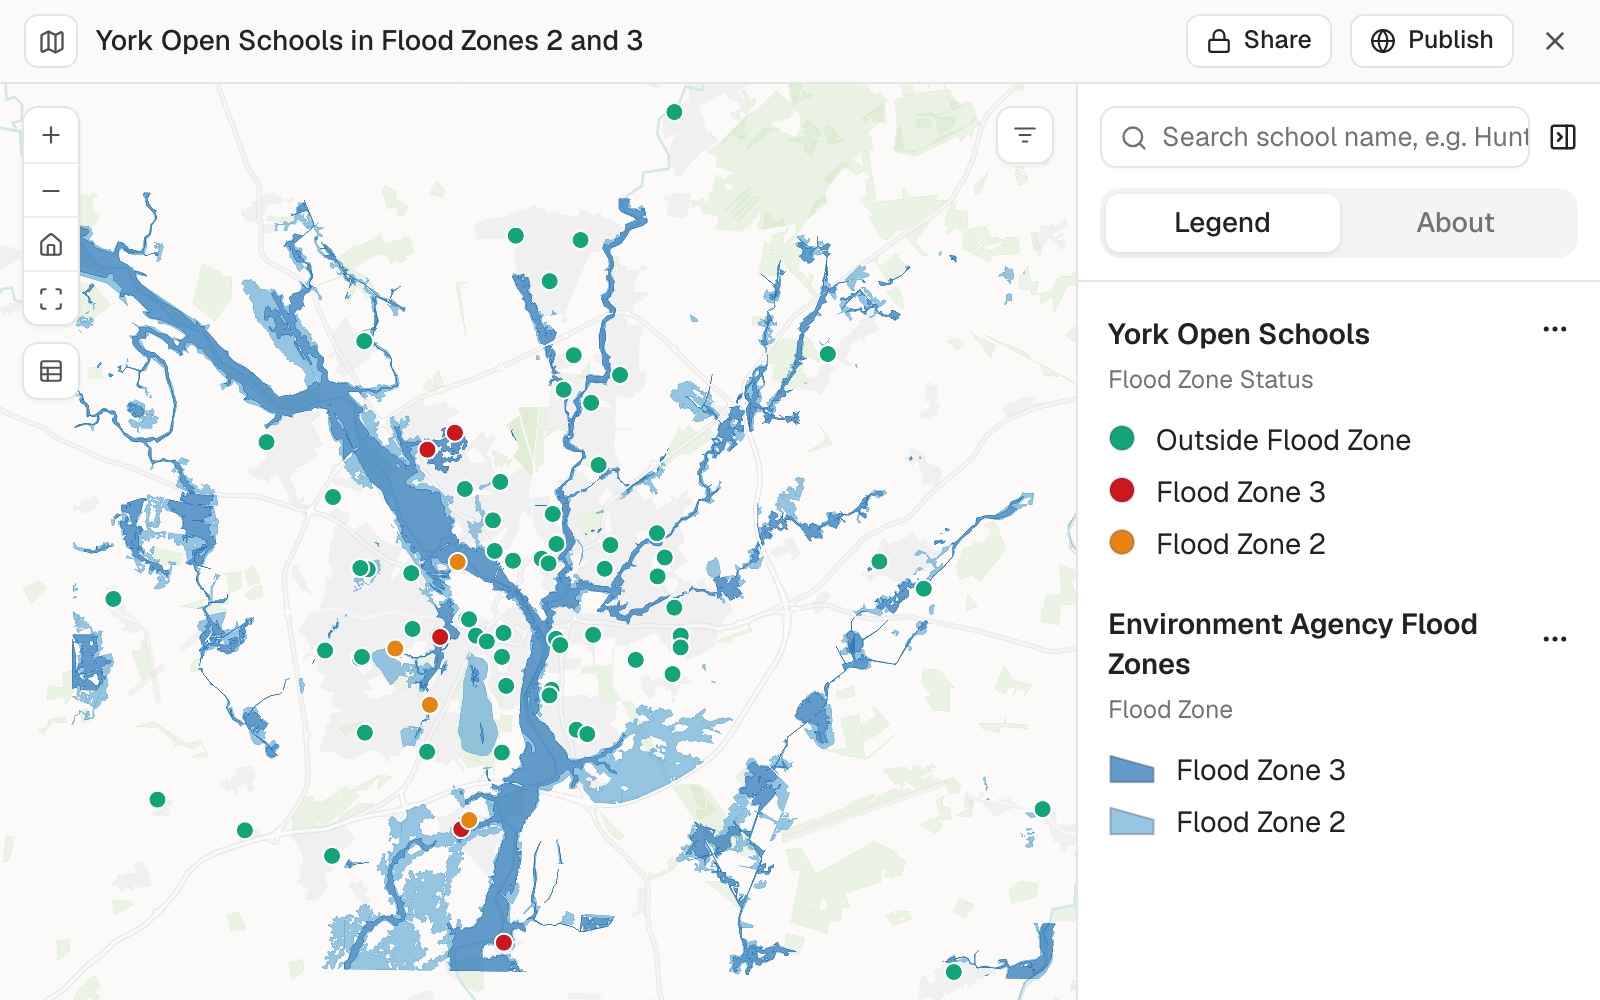
- Find which of your sites sit in a flood zoneEvery site flagged with the zone it is in.
- Score every site for fire, flood and earthquakeA rating per hazard and one score by your own points, ranked and mapped.
- Add up the property value in each flood zoneParcels, homes and value per zone, each counted once in its worst zone.
- See which of your sites a storm hit, and who to call firstEvery site in its strongest wind band, with a call list in order.
- Count the people, homes and places inside a burn areaWho and what sat inside the perimeter, as a map and a summary.
- See which facilities a sea level rise flood reachesSchools, hospitals and fire stations checked against the city’s published flood, by name.
- Count who lives in your evacuation zonesPeople, car-free households and over-65s per zone, and the care homes to move.
- Count what each hazard puts at riskBuildings in each hazard area, and every exposed critical facility by name.
- Rank buildings by fire risk for inspectionEvery building scored on your rules, the worst first.
- Find what a pipeline leak could reach, mile by milePeople, water and protected land along each stretch of the line.
Keep a register of what you own or look after
Assets, addresses, parcels, plots and networks, each in its place on the map and kept up to date.
Tree register by useful life expectancy, Carlton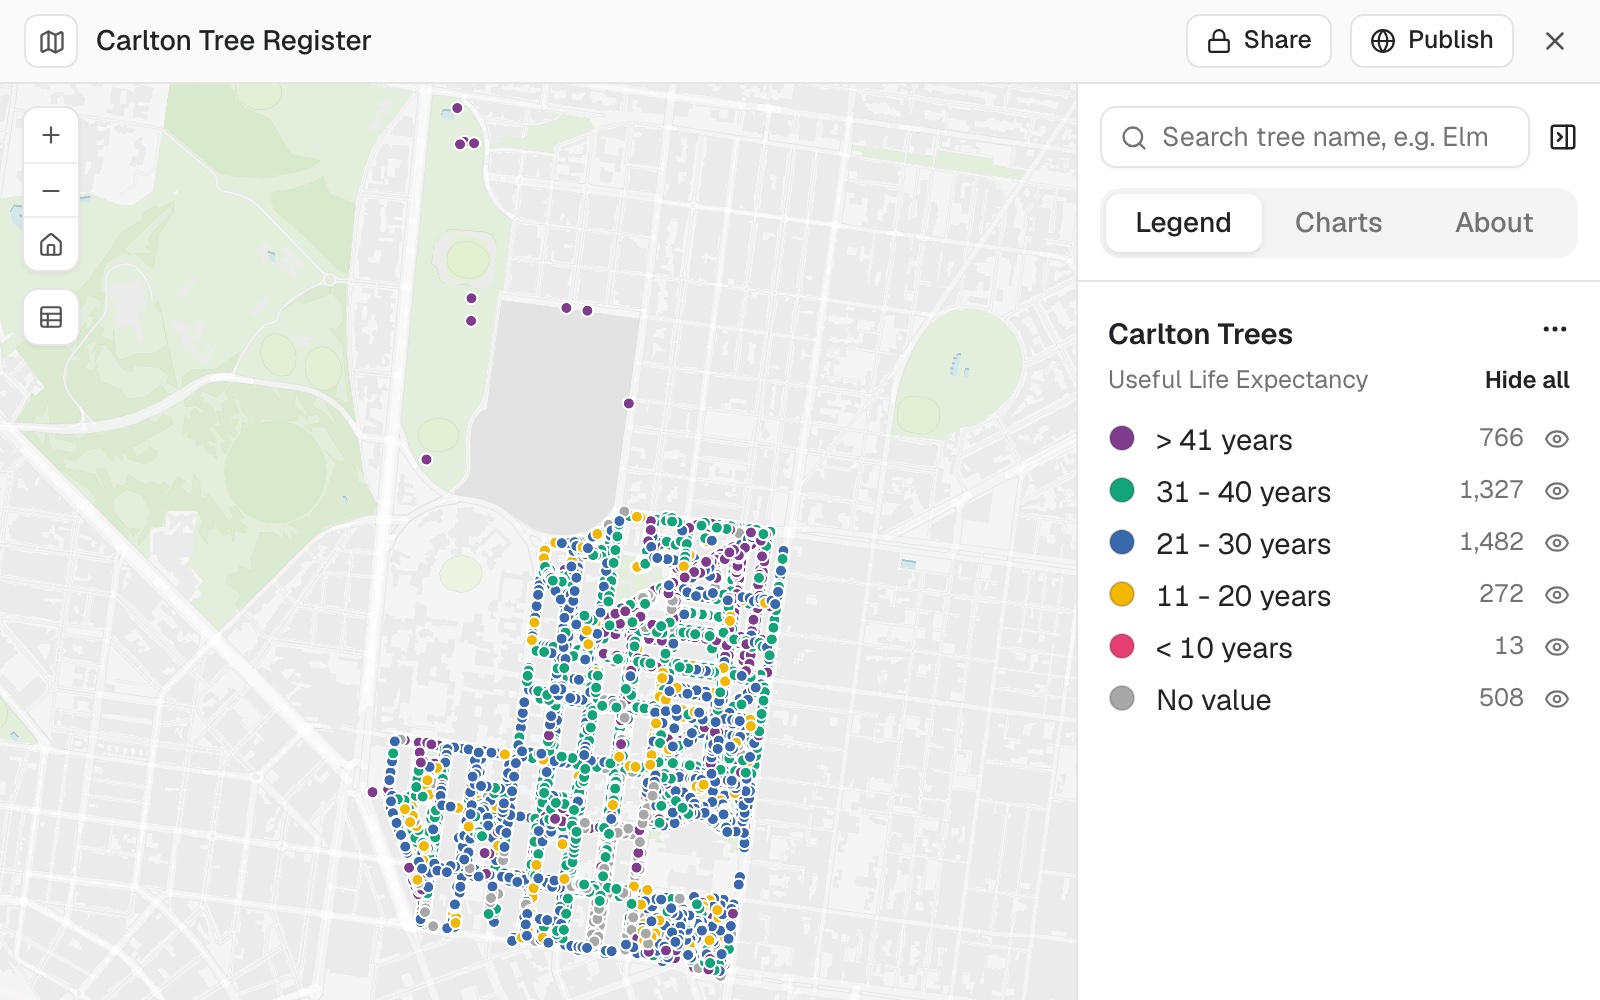
- Keep a register of your assets on a mapA survey as a register, and the list a contractor needs.
- Turn a water main layer into a network registerEvery stretch mapped by owner, summed up, and the gaps listed as a file.
- Check an address register before it goes outDuplicates, zero house numbers and ZIP codes checked, and a map to search by address.
- Update the parcel register from recorded deedsEach sale on its parcel, at its recorded price, and the deeds to check.
- Put rights of way, greens and tree orders on a land registerEvery parcel with what crosses it, covers it or stands on it.
- Check your zoning map against approved rezoningsClass, case number and date checked case by case, and the clear ones corrected.
- Map a cemetery's plots and burial registerEvery burial record in its plot, the empty plots shown, searchable by surname.
- Keep your heritage register on a mapEvery monument by broad group, searchable by number or townland.
- Map your lead service lines and count them for the stateEvery line by lead status, searchable by address.
- Turn a condition survey into a repair programmeEvery segment costed at your rates, ranked and funded to your budget.
- Lay a numbered recording grid over a digEvery square numbered, its corner listed for setting out, on an aerial photo.
Plan, permit and build
Constraints, crossings, costs, notification lists and zoning changes, for a project or a planning case.
Castle Mills, York: site constraints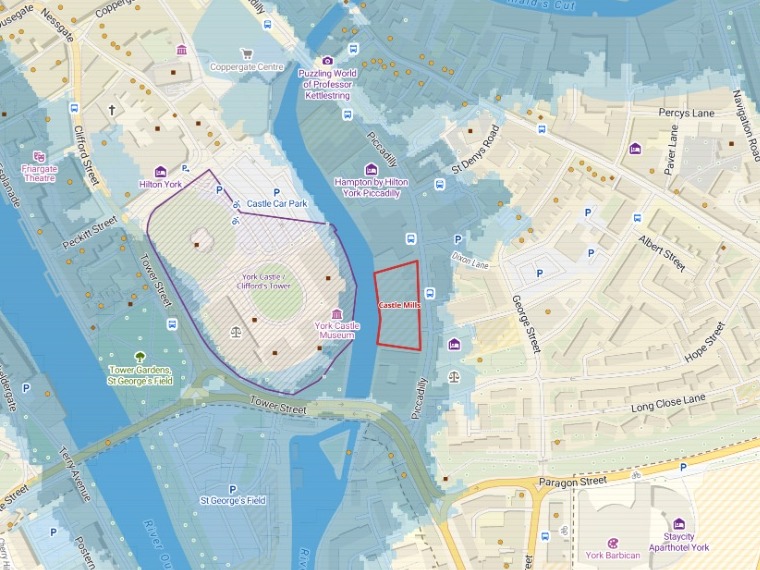
- Map the constraints on and around a siteWhat covers the red line, how far the rest are, and an A3 plan.
- List everything a proposed route crossesEvery road, railway, river and pipeline, in order, with where and how far along.
- Price a route scheme at your own ratesLength, crossings, junctions and bus stops counted and costed, with a map.
- See every parcel a rezoning touchesEach parcel’s district and its zoning now and after, summed up by bill.
- Get every address within a set distance of a siteThe notification list, and a map of the line.
- Find every building that sits in an easementSquare feet inside and share of each building, drainage first.
- Find the dig permits that clash, street by streetDifferent holders digging close together at the same time, and who to call.
- Track every parcel of a land acquisition on one mapEach parcel by deal stage, the acres signed and open, the offers ranked.
- Track new homes district by district from building permitsPermits and net new homes by district and year, mapped and written up.
- Find the comparable sales for a valuationSales within your distance, their median and range, mapped by price.
- Put a plan online for residentsOne public map, a display sheet and a plain page.
- Split and merge fields on a farm's parcel mapNew fields after a fence goes up or comes out, with their hectares.
- Shortlist the places that pass every testTests on the figures and on distance, the shortlist with its figures, on a map.
Understand land, nature and the ground
Habitats, samples, soils, emissions, forests and fields: the ground, what lives on it and how it is changing.
PEA Ecological Baseline: Land West of Copperwheat Avenue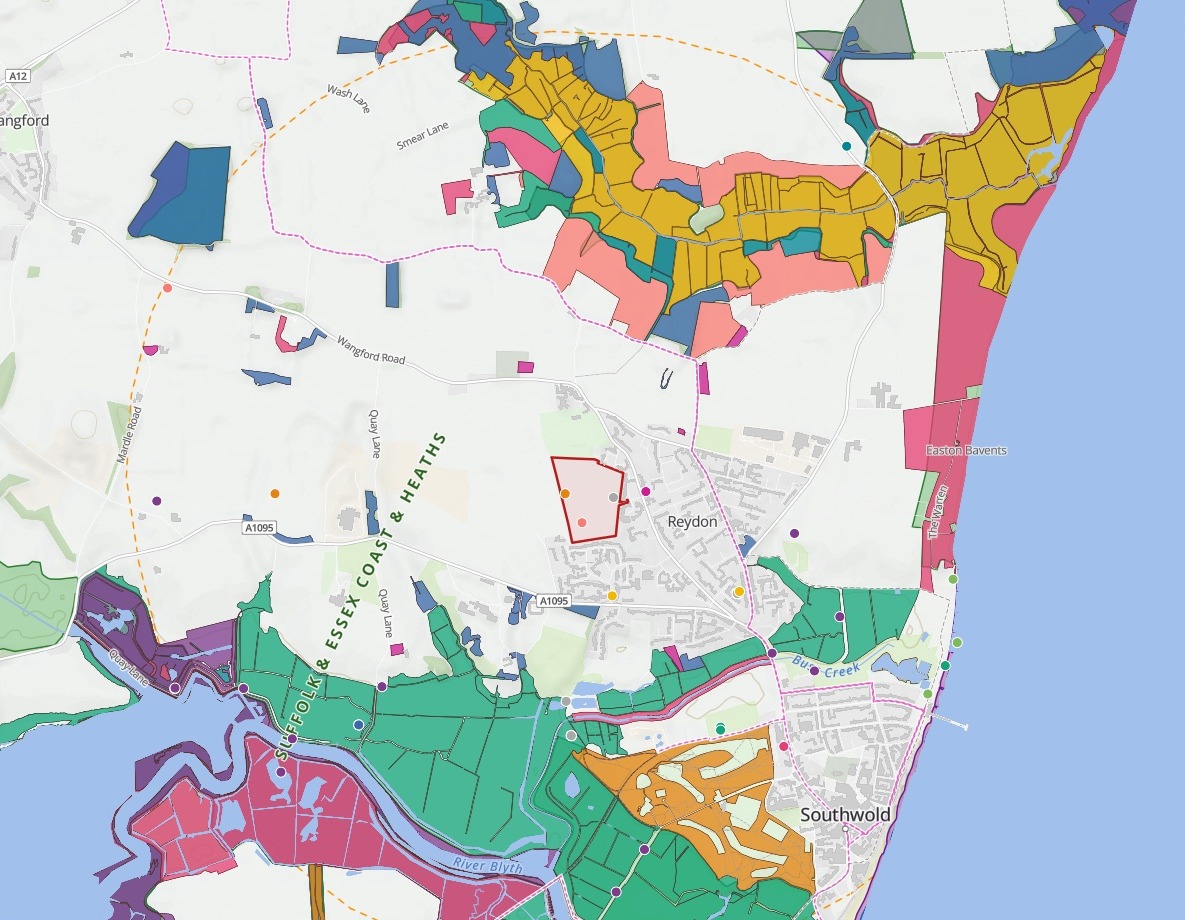
- Map the ecological baseline around a siteDesignated sites, priority habitat and species records within 2 km.
- Work out biodiversity net gain and carbon for a siteUnits before and after, the shortfall to 10%, and tonnes of CO2e.
- Screen development sites for priority habitat and SSSIsThe habitat each site would take and its nearest SSSI, ranked and mapped.
- Find the threatened species hotspots the reserves missSpecies counted per square, reserve cover measured, and the land to protect next.
- Turn river sampling results into a quarterly reportAbove and below the works, each point against your target.
- See which stations already measure a riverFlow, level, rain and groundwater stations counted per water body, the gaps shaded.
- Map where emissions come from, on paper and from spaceA facility inventory beside satellite methane plumes, and the plumes no facility explains.
- Map where groundwater is most easily pollutedVulnerability by class, and each supply’s inner zone on extreme ground.
- Choose where to drill from the borehole recordsYields read against the rock and the faults, and sites that keep your spacing rule.
- Turn stand data and a yield table into a felling programmeEach stand’s volume from your table, the stands to fell, and the years mapped.
- Split a farm into management zones from soil and yieldLow, medium and high zones, and what sets each apart.
- Map where your collared animals wentTracks, home ranges, and who migrated when.
Work with imagery, scans and 3D
Satellite imagery, elevation and lidar, in their real place on a map, and what they show.
Autzen Stadium lidar, Eugene, Oregon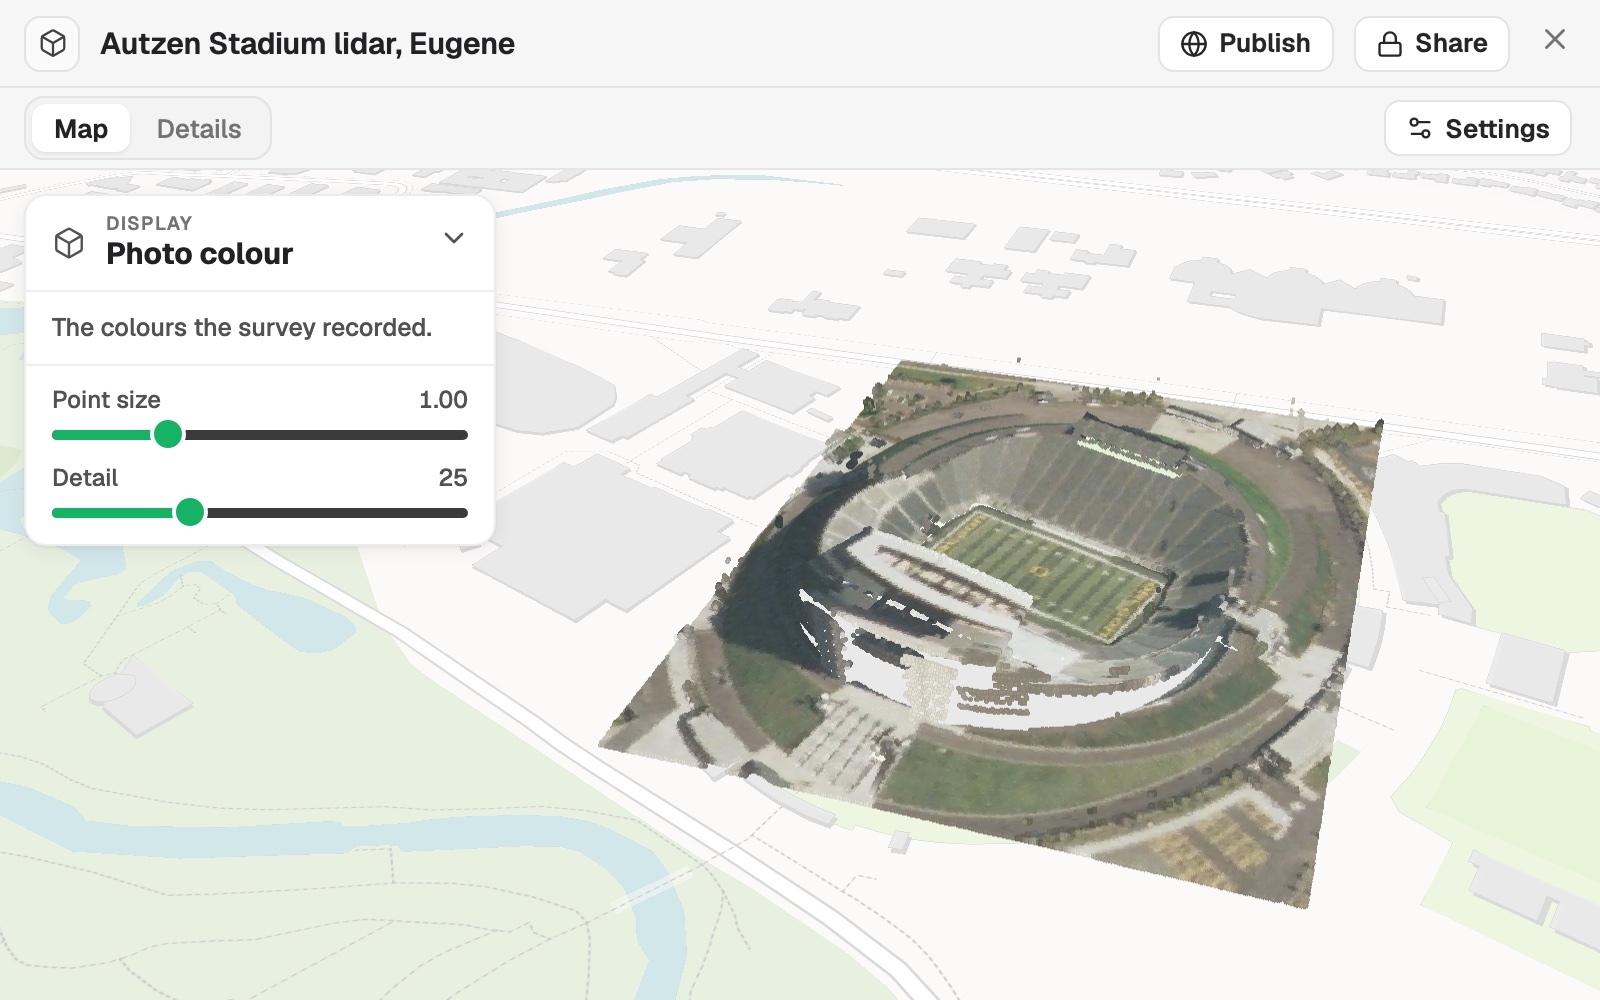
Publish a map for the public or your customers
Maps for a website, a client, a noticeboard or a trail, shared the way you choose and kept current.
York City Centre Visitor Guide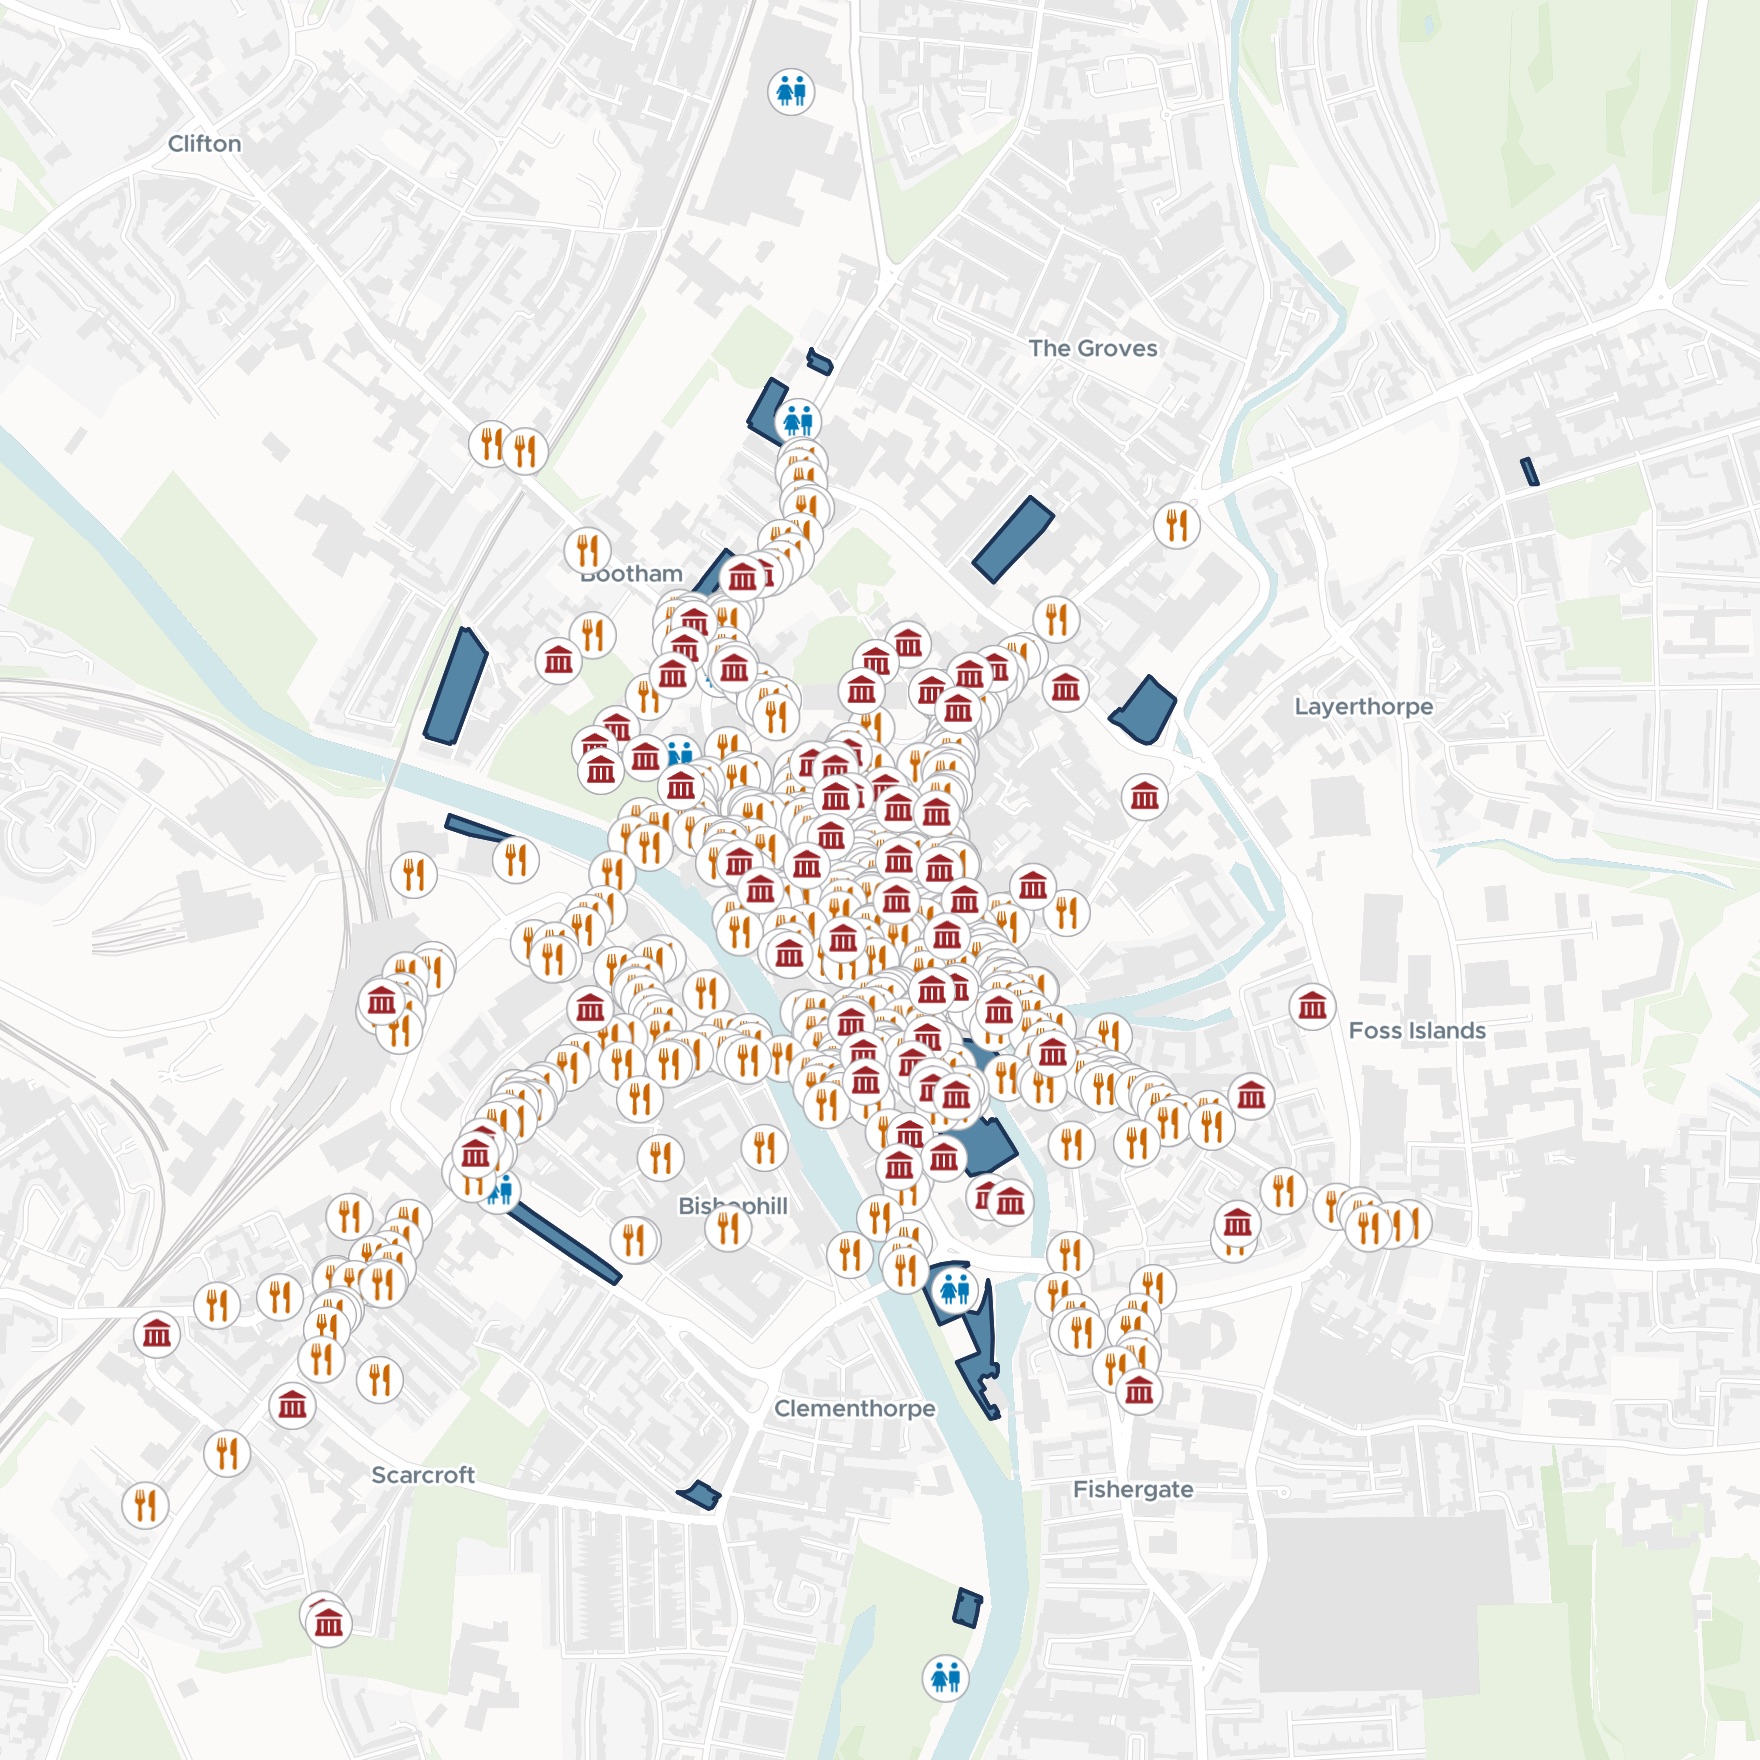
- Give buyers a map of a property sale listEvery parcel by kind, with the filters and pop-up a buyer needs.
- Make a "find us" map for your website and leafletWalking zones, bus stops, car parks and cafés, and the walk from the station.
- Make a visitor guide map of your town centreWhat to see, where to eat, toilets and car parks, on one map for phones.
- Put a trail on a map visitors follow on their phoneNumbered stops in walking order, each with its story and photo.
- Make the map for a park information boardEvery place with its own symbol and a big "You are here", on an A3 sheet.
- Turn your figures into a story readers can followA headline, key points and short passages, each with a map or chart.
- Show residents how each area is doing against its targetA map of every area’s rate, and a plain-English report on who met it.
- Publish open data as a map and a downloadYour portal export tidied, mapped by kind, with the licence and attribution on the map.
- Publish a map that keeps itself currentA public link, refreshed on a schedule.
- Share a map privately with a clientA Viewer seat to open it, filter it and ask it questions, changing nothing.
- Turn a map into a slide, a print or a linkFor people who will never open Mapstack.
Produce the figures, prints and reports
Map sheets to a standard, matching figure sets, journal figures, news graphics and reports for a committee.
Figure 1: Active bus stops per ward, Liverpool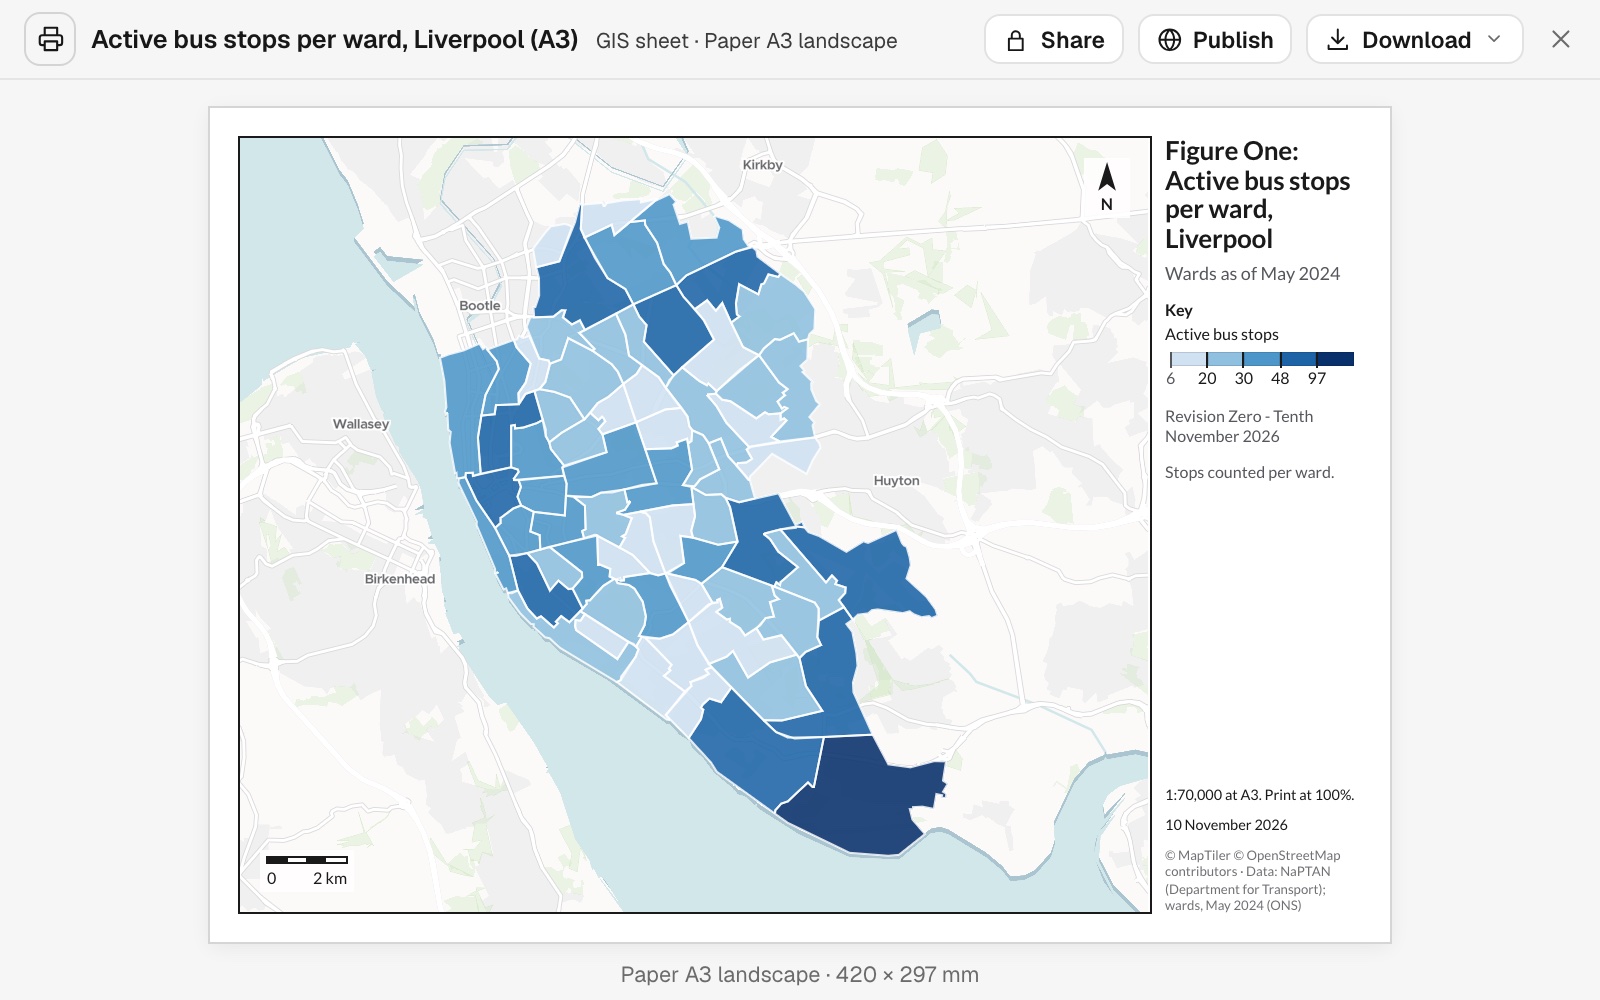
- Turn a map into a figure that meets your standardA title block, a scale statement and a revision.
- Make every figure in a report look like one setOne layout, revised by letter, and the next site.
- Make the study-area figure for a paperSites, rivers, a locator inset and a scale bar.
- Draw a figure-ground plan of a siteBuildings in black, at a stated scale.
- Turn the latest figures into a social postA headline that states the finding, callouts on the two ends, and your source.
- Put a site and its selling points on one pageA property infographic: the site, the stations and who lives nearby, on A4.
- Write the decision report for a committeeEvery area ranked, the first few recommended, with a map, the full table and a method note.
- Write the evidence of need for a funding bidOfficial figures for your area against the city, as a report a funder reads.
- Write the crime brief, then have it repeatEvery crime type and district against last month, as a report a routine makes again.
- Make the map for the next incident briefingThe latest perimeter, laid out on a sheet to print.
Keep an operation running
Dashboards, performance and repeat work that stay in step with the data they come from.
Brooklyn open 311 operations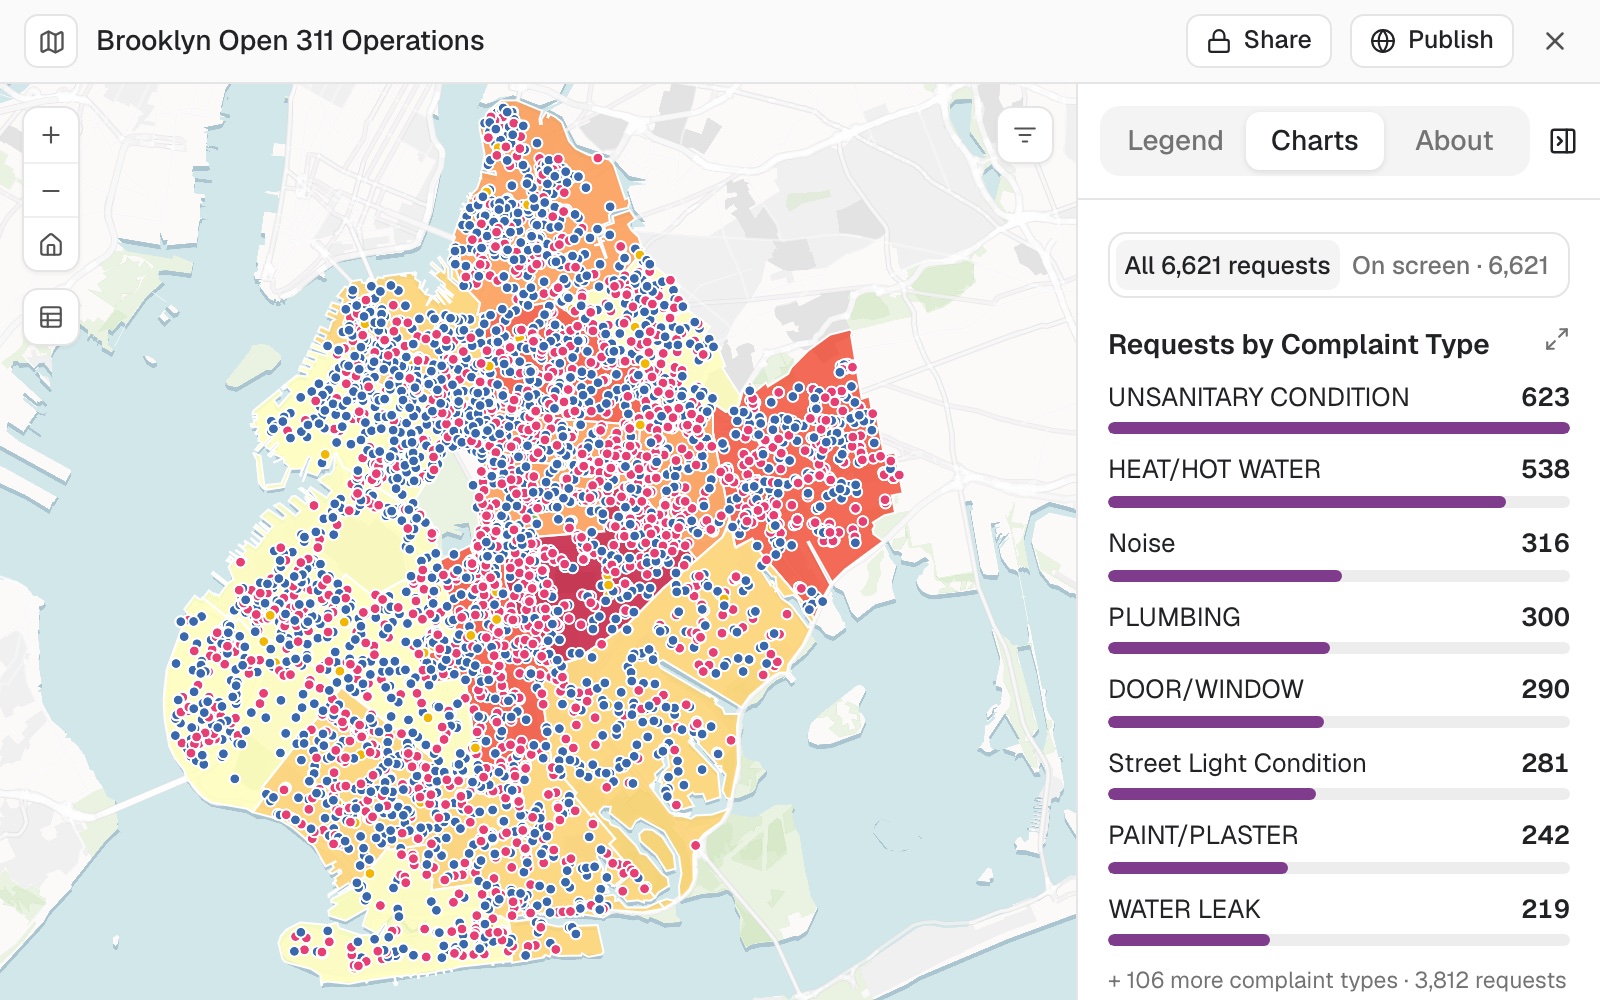
- Build one screen that shows what is happening whereOpen work on a map, with charts and filters.
- Map on-time running by area, year by yearThe share on time shaded by area, with the biggest falls and rises ranked.
- Re-run last month's analysis on new figuresThe same method, the new map, and what moved.
- Keep a map in step with the list it comes fromYour list fetched again from its source on a schedule, and the map with it.
Get data ready to use
Addresses found, files cleaned, tables joined and official boundaries fetched, ready to map.
Vélib' stations by area, Paris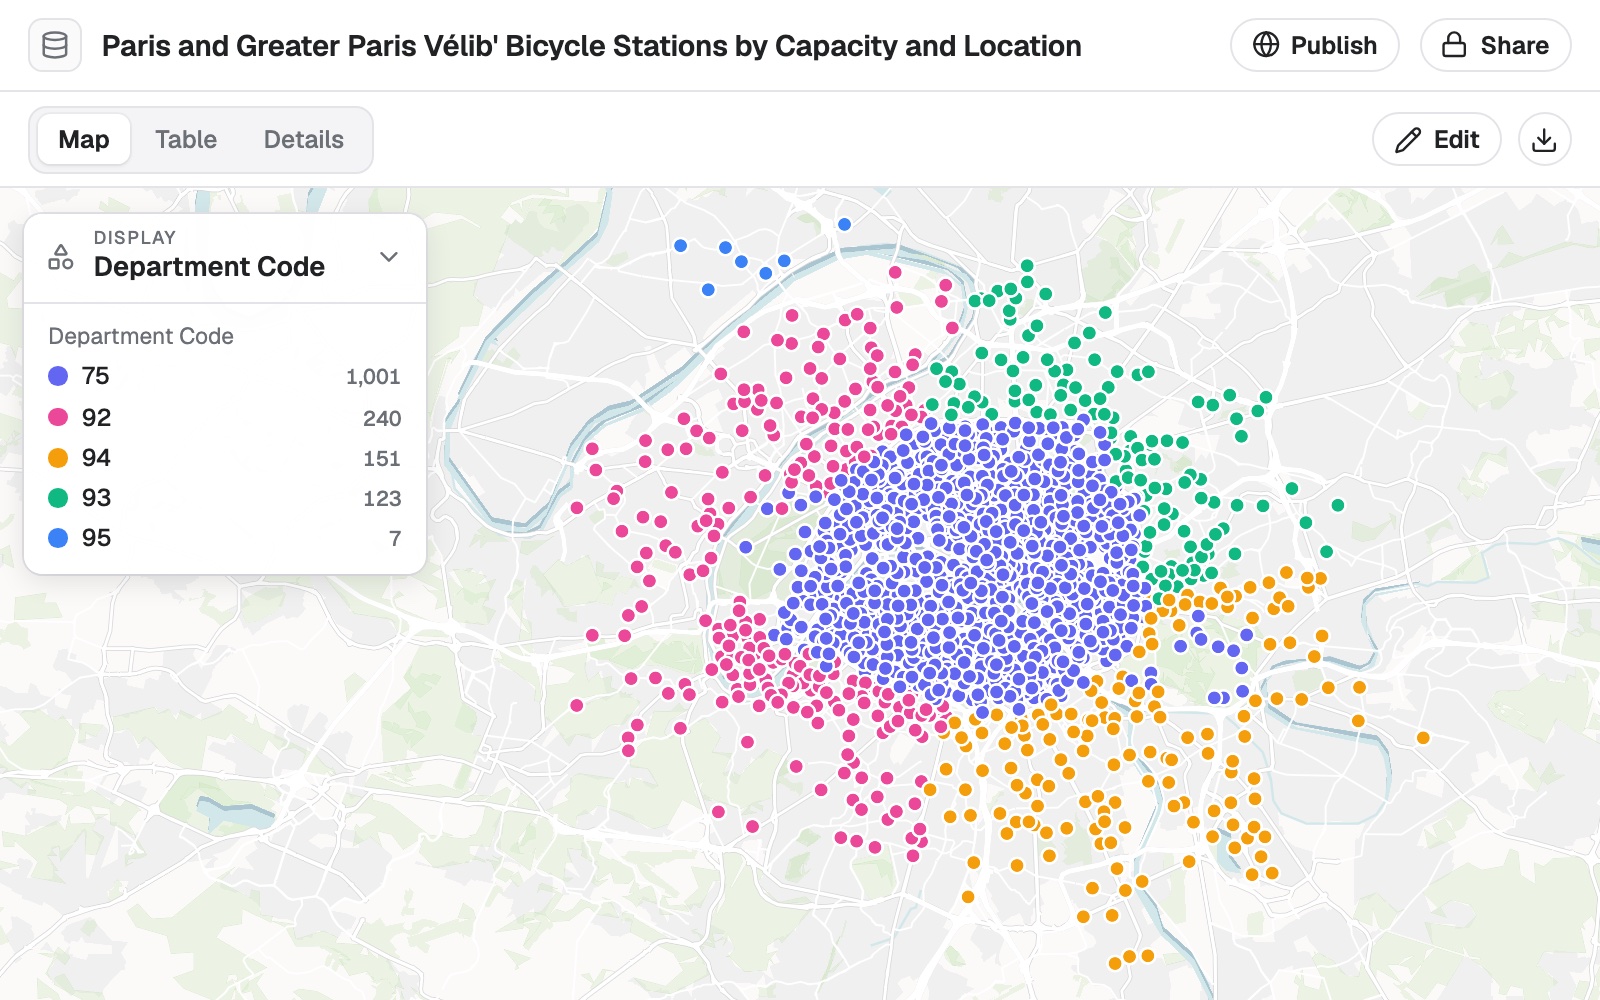
- Put coordinates on every address in a listLatitude, longitude and how precisely each matched, in your own file.
- Clean up a messy file, with a logFiltered, placed and tidied, with every change counted.
- Join two tables, and see what did not matchMatched on a shared ID, counted on both sides.
- Turn a shapefile into a web mapA desktop GIS file, styled and opened from a link.
- Add the area to every row of your listWhich area each place is in, counted and ranked.
- Get official boundaries and the figures for themBy name and edition, with the source of each part.
- Map sensitive records by area, with small counts hiddenEach area shown as 0, "fewer than 5" or its count, and nothing from the records.
- Gather the base layers for a place onto one mapBoundary, census figures, facilities and roads, each with its source and release.
Not on the list? Describe the job.
Free to start. No card.