
Track playback from AIS data
Play back a day of vessel traffic.
Attach your AIS position reports. You get each vessel's track on a map, a time slider in your local time, and an account of what each vessel did.
Free to start. Reports and prints on a paid seat.
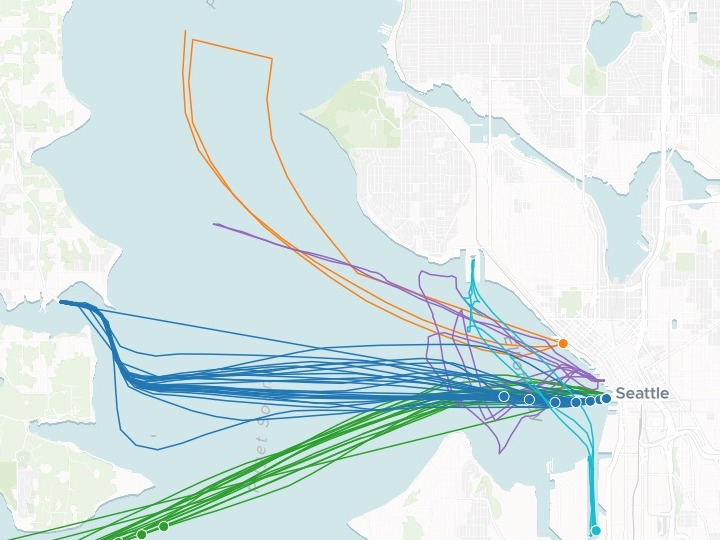
| Five vessels, one day | Kind |
|---|---|
| WSF Tacoma | Ferry |
| WSF Chimacum | Ferry |
| Victoria Clipper V | Passenger ferry |
| Great Land | Cargo ship |
| Linda Lee Bouchard | Tug |
The dots are each vessel’s positions in one ten-minute step. On the map, a slider plays them along the lines through the day.
For whoever has to explain how the traffic moves
Port planners.Ferry operators.Safety committees.AIS says where every vessel was, minute by minute.
The question is what happened, and when.
AIS reports arrive as rows: a vessel, a time in UTC, a position and a speed. Played back on a map in local time, they show the day as it happened. Mapping people call this track playback.
One real day
Five vessels in Elliott Bay, written up one by one
Two ferries, a passenger ferry, a cargo ship and a tug off Seattle on 15 June 2023, from the US Coast Guard's AIS data as published by NOAA. The file was in UTC; Mapstack gave every time in Seattle time, with UTC beside it.
- WSF Tacoma
- 26one-way crossings, between 17:08 the evening before and 16:20
- WSF Chimacum
- 16one-way crossings across the bay
- Victoria Clipper V
- 08:10left Seattle heading north; back between 15:33 and 15:50
| When the tug Linda Lee Bouchard was under way | Minutes |
|---|---|
| 07:09–07:35 | 26 |
| 08:11–08:35 | 24 |
| 08:59–09:26 | 27 |
| 09:59–10:15 | 16 |
| 10:40–10:50 | 10 |
| 13:48–14:11 | 23 |
| 15:21–15:52 | 31 |
It times the work to the minute.
Mapstack listed the tug's working windows through the morning and afternoon, and noted its early-morning and late-evening moves as well. It also caught the Clipper's run of the evening before, docked between 19:42 and 20:00.
NOAA Office for Coastal Management and BOEM, Marine Cadastre: AIS Vessel Traffic, 15 June 2023, from U.S. Coast Guard AIS. Trimmed to Elliott Bay and its approaches and five vessels. Downloaded and attached on 15 November 2026, and run the same day.
How it goes
You bring the position reports. Mapstack draws the tracks and writes up the day.
Attach the position reports and say how the day should play.
Mapstack builds the map, ready to play through the day.
You get the day in writing.
The map is where it starts
Ask about the day, then take the tracks to the people who need them. Each of these is something you can ask for today.
Ask about the day
Answered from the positions on the map.
- Examine each vessel's speed through the day.
Show the committee
One link they can open and play.
- Publish the map as a link our safety committee can open.
Put it in the pack
For a briefing paper or an appendix.
- Make a static map of the day's tracks for our report.
Common questions
What happens to our AIS data?
It stays in your workspace. Only people with a seat in your workspace can see it. Nothing leaves unless you publish it yourself.
It is not used to train AI. Your data and your conversations are not used to train AI models.
It is still yours. You keep ownership of what you bring in. Delete it and it is removed.
The full answer is in the documentation: Your data, privacy and security.
What does it cost?
Free to start. One seat, for you, with a starter amount of work each month. No card.
The playable map and the written account are on the free seat. With your own files and public sharing.
Reports and prints are on a paid seat. Paid seats are per person, and bring more work each month.
The prices are on the pricing page.
What do I see for each vessel?
Its track. The whole day as a thin line, in its own colour.
Where it is. As the slider plays, its positions for that step show on top, moving along the line.
Its details. Click it for its name, the time and its speed in knots.
Play back yours.
Free to start. Reports and prints on a paid seat.