
White space analysis for a store network
Find where there is room for more stores.
Give Mapstack your stores and your competitors. You get a map of who serves each area, and a range for how many more stores the market could take.
Free to start. No card.
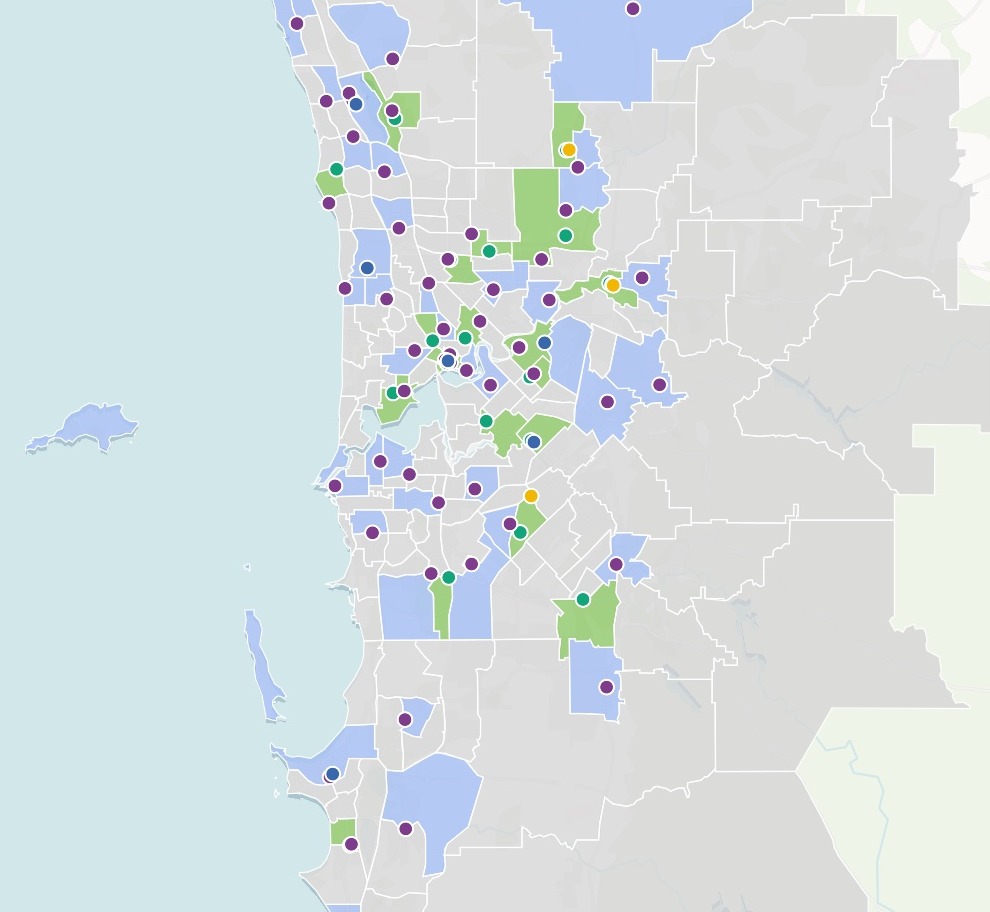
| Suburbs, by who trades there | Areas |
|---|---|
| With one of ours | 19 |
| Competitors only | 44 |
| No store of any brand | 122 |
Room for about 34 more stores, at one store per 40,000 residents.
For whoever has to size the market
The board asks how many more stores the city can take.Then where.
Then how sure you are.
The usual answer is a guess scaled from another city, or a study that takes a quarter to arrive.
This gives you the areas, the number and the assumptions behind it, from your own store list, for a chain or a franchise.
One real market
19 stores, three competitors, 2.1 million people
A fast-food chain's stores and its three competitors' in Greater Perth, taken from each brand's own store finder, set against census population for every suburb.
- The areas
- 185suburbs, 122 of them with no store of any of the four brands
- The people
- 2,116,648residents, from the 2021 Census
- The answer
- 34more stores, at one store per 40,000 residents
| If one store needs | More stores the city could take |
|---|---|
| 50,000 residents | 23 |
| 40,000 residents: the stated rule | 34 |
| 30,000 residents | 52 |
A single number hides how much it depends on the rule.
At one store per 40,000 residents the city could support about 53 of the chain’s stores, and it has 19, so 34 more. Ask for a range and it ran from 23 to 52, with neighbouring underserved suburbs paired into groups of about 40,000 people as the places to look first.
Stores: each brand's own store finder. Population: Australian Bureau of Statistics, 2021 Census, by SA2. Run on 11 November 2026.
Ask why two figures differ
Two readings of the same market can both be right. Ask which is which.
Which one to plan with is your call.
Your two pools add up to 45 stores, but the base case says 34 more. Which is right, and why do they differ?
Both, for different questions. The 34 treats the whole city as one market and sets your 19 existing stores against it. The 45 counts only the people in areas with no store of yours.
How it goes
You bring the stores and state the rule. Mapstack does the counting.
Attach your stores and your competitors, and say how many people a store needs.
Mapstack sorts every area: yours, your competitors’, or nobody’s.
You get the number as a range, and the areas to look at first.
The step-by-step guide is in the documentation: Find where there is room for more stores, and roughly how many.
Common questions
What happens to my store list?
It stays in your workspace. Only people with a seat in your workspace can see it. Nothing leaves unless you publish it yourself.
It is not used to train AI. Your data and your conversations are not used to train AI models.
It is still yours. You keep ownership of what you bring in. Delete it and it is removed.
The full answer is in the documentation: Your data, privacy and security.
What does it cost?
Free to start. One seat, for you, with a starter amount of work each month. No card.
This job is on the free seat. Maps, datasets, analysis, your own files and public sharing are all included.
Pay per person for more. A paid seat brings more work each month, and seats for your team.
The prices are on the pricing page.
Where does the number come from?
Your rule. One store per so many residents is your assumption, and it is written down with the answer.
Census population. Fetched for every small area, with the release named.
Every store counted. Yours and your competitors’, placed from the file you attach.
A range. Ask for one and you get the low, the high and what moves it.
Size yours.
Free to start. No card.