
A CompStat-style crime brief
Write this month's crime brief.
Attach two months of incident records and your police district boundaries. You get the brief as a dated report with maps, and a routine to make it again.
Reports and routines are on a paid seat.
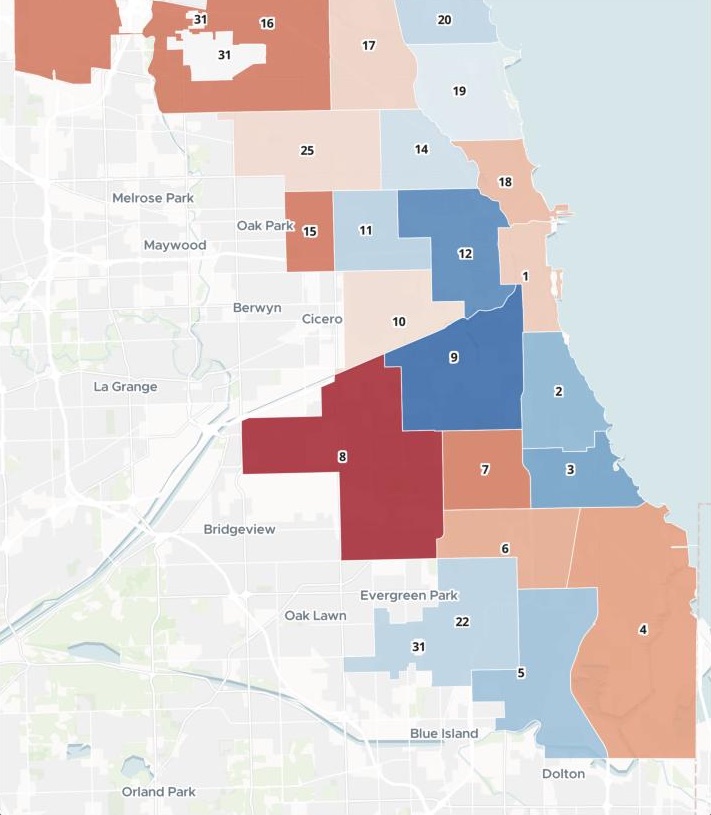
| October against September | Incidents |
|---|---|
| District 8, rose most | +108 |
| District 9, fell most | −119 |
Every district is in the report's table, from the largest rise to the largest fall.
For whoever writes the crime brief
Crime analysts.Policy teams at a public safety nonprofit.Community safety officers.
The brief goes to elected officials and community groups, and it is built by hand every time.
A CompStat-style brief sets this month against the last, crime type by crime type and district by district, and leads with what moved.
Here you attach the city's crime statistics and its district boundaries. Mapstack writes the brief, the tables and the maps.
One real month
Crime held nearly flat. The districts did not.
The City of Chicago's crime data for September and October 2026, from its open data portal, with the city's police district boundaries. October's brief, against September.
- Rose most
- Criminal damagenot on the list asked for; Mapstack added it because it led the rises
- Biggest fall in percent
- −14.7%weapons violations, of the types asked for
- Biggest fall in number
- Assaultof any crime type, and the line the brief leads with
- Rose
- 11
- Fell
- 11
- Unchanged, District 31
- 1
It adds what a careful analyst would.
October has a day more than September, so the brief gives the daily average beside the total. It says the arrest flag is an incident’s status, not a count of people arrested, and that raw counts are not rates per resident.
City of Chicago, Crimes - 2001 to Present and Boundaries - Police Districts, Chicago Data Portal. Incidents dated 1 September to 31 October 2026. Run on 15 November 2026.
Next month, without starting over
A routine is a job Mapstack does again without you. Ask for its instructions in the same conversation.
In the routine’s form you choose when it runs: weekly, or start it with Run now when the new month’s records are out. Another system can start it too.
I want this same brief every month from the latest data: set it up to repeat, so each month it pulls the newest full month from the same open data feed and compares it with the month before.
Routines are set up in Settings, so Mapstack wrote the instructions to paste in: fetch the previous full month from the city's crimes feed, compare it with the month before using the saved police district boundaries, and write the same brief with both maps.
How it goes
You bring the records. Mapstack writes the brief.
Attach two months of records and the district boundaries.
Mapstack writes the brief with its tables and maps.
You send it on to the people it is for.
Common questions
What happens to our records?
It stays in your workspace. Only people with a seat in your workspace can see it. Nothing leaves unless you publish it yourself.
It is not used to train AI. Your data and your conversations are not used to train AI models.
It is still yours. You keep ownership of what you bring in. Delete it and it is removed.
The full answer is in the documentation: Your data, privacy and security.
What does it cost?
Reports and routines are on a paid seat. Paid seats are per person, and bring more work each month.
Free to look around. Maps, datasets and analysis are on the free seat. No card.
The prices are on the pricing page.
What is in the brief?
Every type and every district. This month and last, with the number and the percent change.
Two maps. The month’s crime by district, and the change from the month before.
A note on the data. How it was counted, what it covers and what it does not measure, in the report itself.
Write yours.
Reports and routines are on a paid seat.