
De-identify data before you map it
Map sensitive records without identifying anyone.
Attach the records. You get a map of counts by area, with every small count shown as 'fewer than 5' and nothing from the records on it.
Free to start. No card.
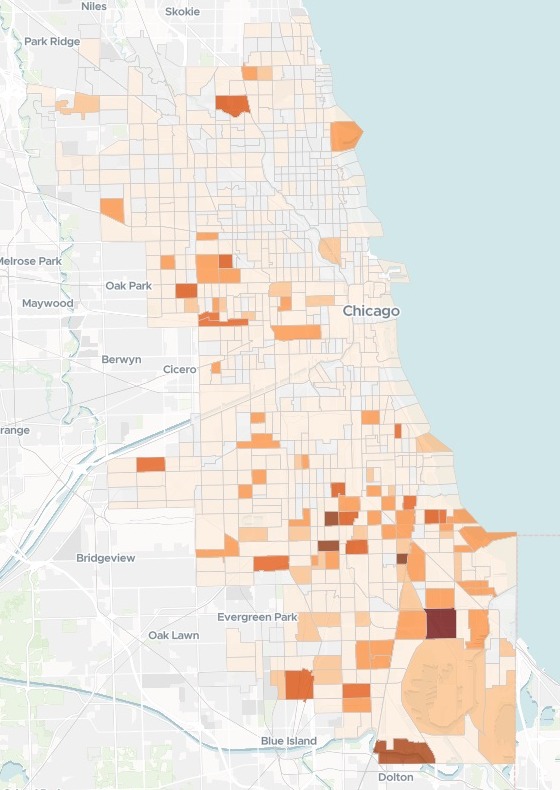
| Incidents in a tract | Shown as |
|---|---|
| None | 0 |
| 1 to 4 | Fewer than 5 |
| 5 or more | The count, darker for more |
| The highest tract | 15 |
The rule is in the key: a pale tract means few, not none.
For whoever publishes counts about people
Safeguarding charities, public health teams, records officers at a council or a police force.The records say exactly where.
What you publish must not.
An area with one or two incidents can point to one household. Showing it as 'fewer than 5' instead is small-cell suppression, a standard part of disclosure control.
You name the areas and the threshold you work to. Mapstack does the counting, and tells you what could still give someone away.
From one row per incident to one count per area
Columns: Date and time (when it happened), Block (the street block), Latitude, longitude (the block’s position), Offence (what was recorded), Case number (the police case). 1,628 rows. Placed to the street block, as the city publishes them.
What goes on the map
- Every census tract in the city, fetched for you.
- Its count, or "fewer than 5".
- Nothing from the records.
One real city
A year of records, and no small number on show
The City of Chicago's published police records for 2025 in one category: offences involving children. Mapstack fetched the city's 789 census tracts from 2020 and counted the records in each.
- Zero
- 247tracts with no incident, shown as 0
- Left out
- 87records with no coordinates, 5.3% of the file
- Suppressed
- 449tracts with 1 to 4, shown as "fewer than 5"
- Shown with its count
- 93
- Fewer than 5
- 449
It reported what it could not place.
Mapstack left out the records with no coordinates in the source, said so, and suggested a footnote on the website saying that unplaced incidents were not counted.
City of Chicago Data Portal, Crimes - 2001 to Present, from the Chicago Police Department: 2025, one category, locations to the block as published. Census tracts, 2020, fetched by Mapstack. Run on 15 November 2026.
Take the raw count out of the data too
The map shows only the count as suppressed. Ask, and the table behind it matches.
Yes, please remove the unsuppressed count column, so the dataset behind the map holds only the tract and the count as shown ('0', 'fewer than 5' or the number). Then tell me which columns are left.
Mapstack removed the column and listed what stays once you save: the count as shown, the tract's codes, its community area and its boundary.
How it goes
You bring the records and your rule. Mapstack does the counting and the hiding.
Attach the records and say the rule.
Mapstack counts and maps the areas, and nothing else.
You get what to check before you share.
Common questions
What happens to our records?
It stays in your workspace. Only people with a seat in your workspace can see it. Nothing leaves unless you publish it yourself.
It is not used to train AI. Your data and your conversations are not used to train AI models.
It is still yours. You keep ownership of what you bring in. Delete it and it is removed.
The full answer is in the documentation: Your data, privacy and security.
What does it cost?
Free to start. One seat, for you, with a starter amount of work each month. No card.
This job is on the free seat. Maps, datasets, analysis, your own files and public sharing are all included.
Pay per person for more. A paid seat brings more work each month, and seats for your team.
The prices are on the pricing page.
Can it follow our own rules?
Your threshold. Fewer than 5, fewer than 10: say the number you work to.
Your areas. Census tracts here. Name the areas you report on, or attach your own.
Your public link. When you are ready, publish the map, not the table of records behind it.
Share yours.
Free to start. No card.