
Election results map
Map an election, seat by seat.
Name the election. You get a map of who won each seat, by how much, and the turnout, built from the official results.
Free to start. No card.
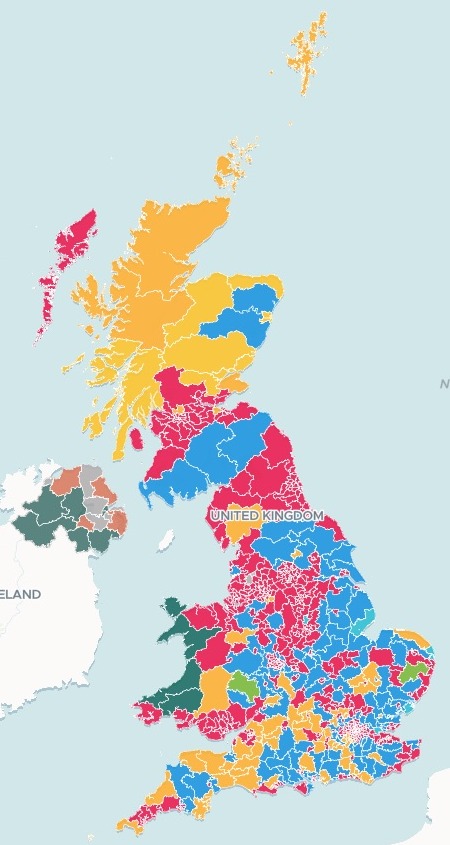
| Seats won | |
|---|---|
| Labour | 411 |
| Conservative | 121 |
| Liberal Democrat | 72 |
| SNP | 9 |
| Sinn Féin | 7 |
| Independent | 6 |
| Reform UK | 5 |
| DUP | 5 |
| Green | 4 |
| Plaid Cymru | 4 |
And six more: SDLP 2; Alliance, TUV, UUP and the Speaker 1 each. Every count is in the reply and charted beside the map.
For whoever maps the count
Data desks.Election offices.Researchers and students.The results come as a table of seats.
Readers want a map.
A map that shades each area by its figure is a choropleth. An election needs three: who won, by how much, and how many turned out.
Here you name the election. Mapstack finds the published results and the boundaries they belong to, and joins them seat by seat.
One real election
Every seat, with its majority and its turnout
The 2024 UK general election. Mapstack found the House of Commons Library's results for every constituency and the Office for National Statistics' boundaries itself, and joined them.
- Closest seat
- Hendonwon by 15 votes, the closest of all 650 seats
- Highest turnout
- 75.21%in Harpenden and Berkhamsted
- Lowest turnout
- 39.99%in Manchester Rusholme
| The ten closest seats | Votes | Of valid votes |
|---|---|---|
| Hendon | 15 | 0.04% |
| Poole | 18 | 0.04% |
| Basildon and Billericay | 20 | 0.05% |
| North West Cambridgeshire | 39 | 0.09% |
| Central Devon | 61 | 0.11% |
| Havant | 92 | 0.22% |
| South Basildon and East Thurrock | 98 | 0.25% |
| Peterborough | 118 | 0.28% |
| Exmouth and Exeter East | 121 | 0.24% |
| Beverley and Holderness | 124 | 0.28% |
A majority is the winner’s lead over the runner-up; the smallest are the marginal seats.
Mapstack gave each one in votes and as a share of the valid votes, with the runner-up.
House of Commons Library, 2024 general election constituency summary (research briefing CBP-10009), and the Office for National Statistics' July 2024 Westminster Parliamentary Constituency boundaries, both found by Mapstack. Run on 14 November 2026.
Three views, one map
Readers switch between them in the legend.
- Winning party: each seat in the colour of the party that won it.
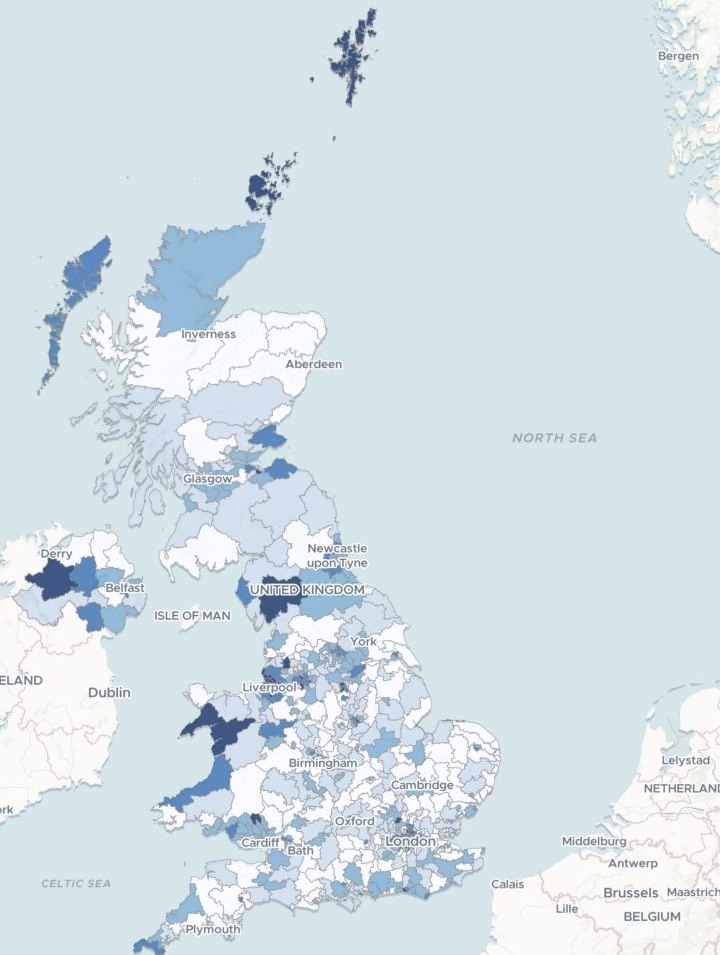
- Majority: the winner’s lead as a share of the valid votes, in five shades.
- Turnout: the valid votes as a share of the electorate, in five shades.
How it goes
You name the election. Mapstack brings the results.
Name the election and what to show.
Mapstack finds the results and maps them.
Your readers open one link.
Common questions
Where do the figures come from?
The published results. Here, the House of Commons Library’s, for every constituency.
The matching boundaries. Here, the Office for National Statistics’ July 2024 constituencies.
Named in the reply. Mapstack says which files it found and used.
What does it cost?
Free to start. One seat, for you, with a starter amount of work each month. No card.
This job is on the free seat. Maps, datasets, analysis, your own files and public sharing are all included.
Pay per person for more. A paid seat brings more work each month, and seats for your team.
The prices are on the pricing page.
What happens to our maps before we publish?
It stays in your workspace. Only people with a seat in your workspace can see it. Nothing leaves unless you publish it yourself.
It is not used to train AI. Your data and your conversations are not used to train AI models.
It is still yours. You keep ownership of what you bring in. Delete it and it is removed.
The full answer is in the documentation: Your data, privacy and security.
Map your election.
Free to start. No card.