
Mapstack for telecom
The AI teammate for telecom GIS work.
Ask in plain words. Mapstack makes the map, the list or the report.
Free to start. No card.
Where broadband stands today
Most decisions about a network come down to locations. Getting them counted is the slow part.
Every team asks, and one desk answers
Sales, regulatory, construction and leadership all need location answers. They land on someone who also has the network records to look after.
It starts from a list that is not yours
The unit of work is the single location. Most jobs begin by matching your own addresses to an official list that is reissued, and is sometimes wrong.
It comes round again, and someone signs it
Filings, grant reports and each new build phase arrive on someone else’s calendar. What goes out can be challenged, so every count needs its source.
An answer for every location your network reaches.
What changes with Mapstack
Today a question waits behind the network records, and lists are matched by hand in a spreadsheet. With Mapstack, staff ask and get on with the decision.
Anyone in the business can ask
Ask in plain words or in GIS terms. A map, a list, an analysis or a report comes back, ready to check.
- Or ask
How many households are in each county we fund?
Split our business accounts in Texas into six even sales territories.
Accounts by sales territory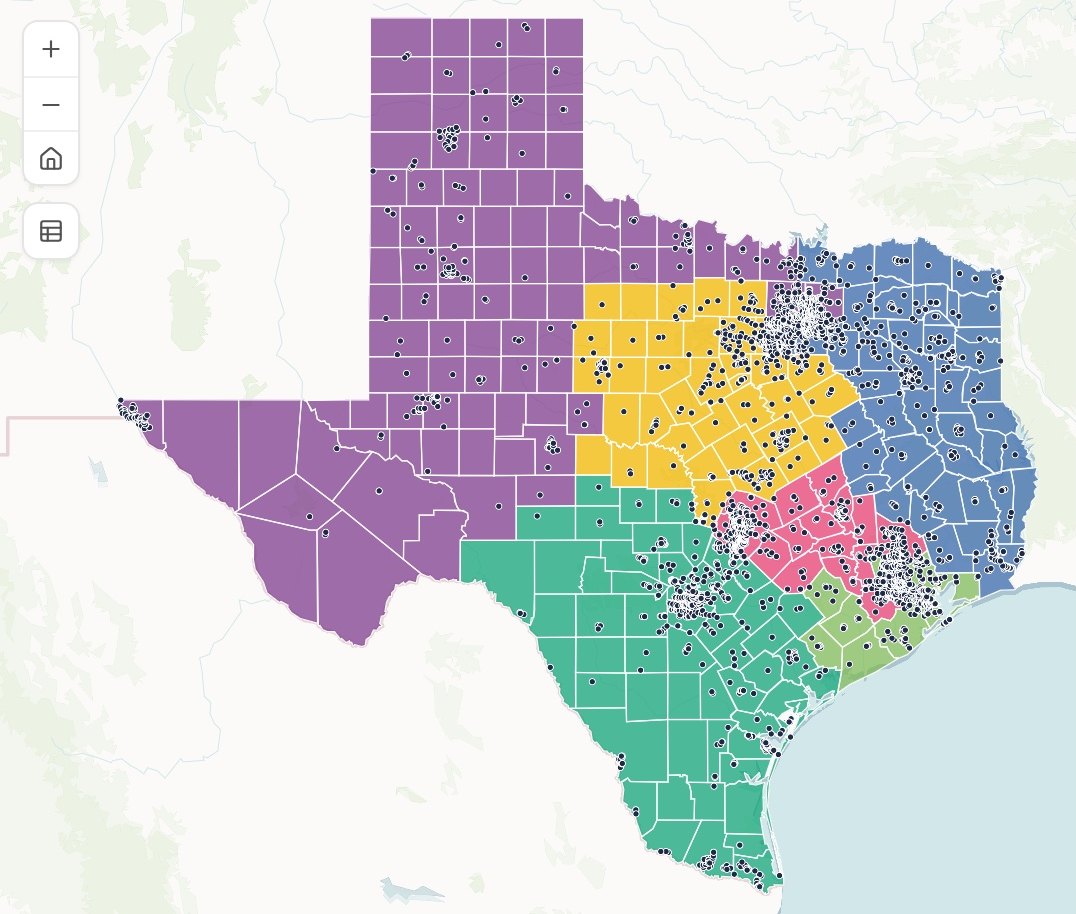
- Or ask
Start from a location list you can trust
Clean an address list, put it on the map, match it to another list and see what did not match.
- Or ask
Which of our serviceable addresses did not match the official location list?
Which addresses in the county’s list are duplicates or have no house number?
A town’s address register, by kind of site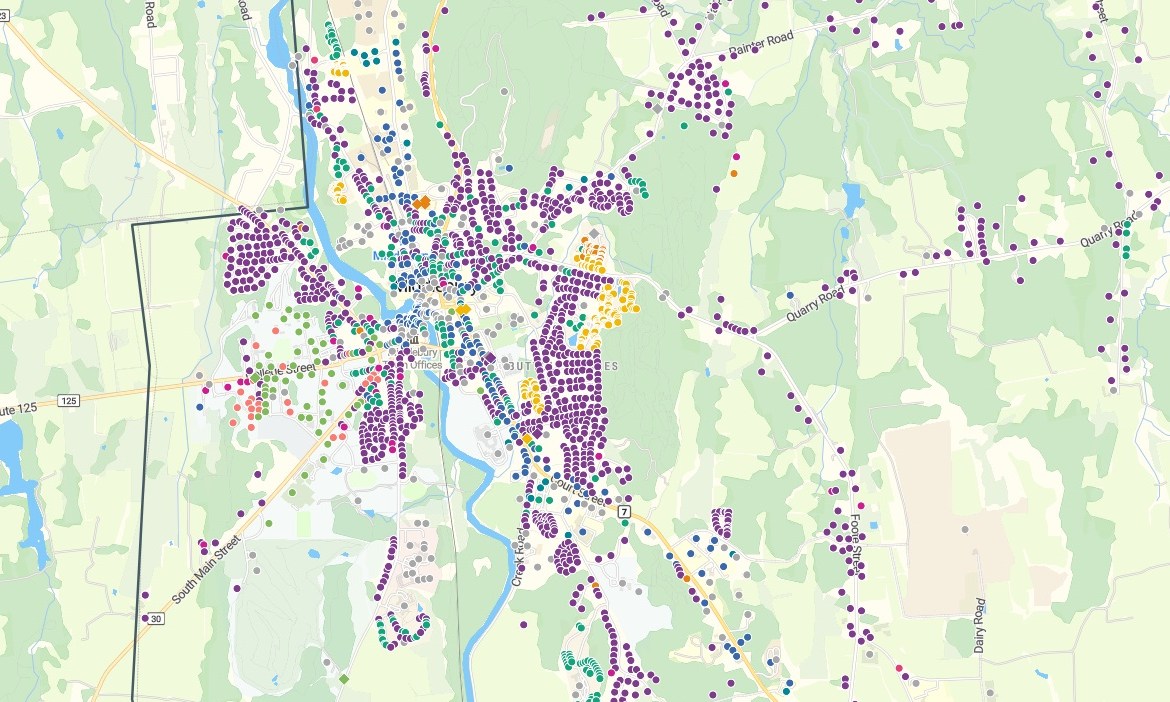
- Or ask
See where service reaches, and where it stops
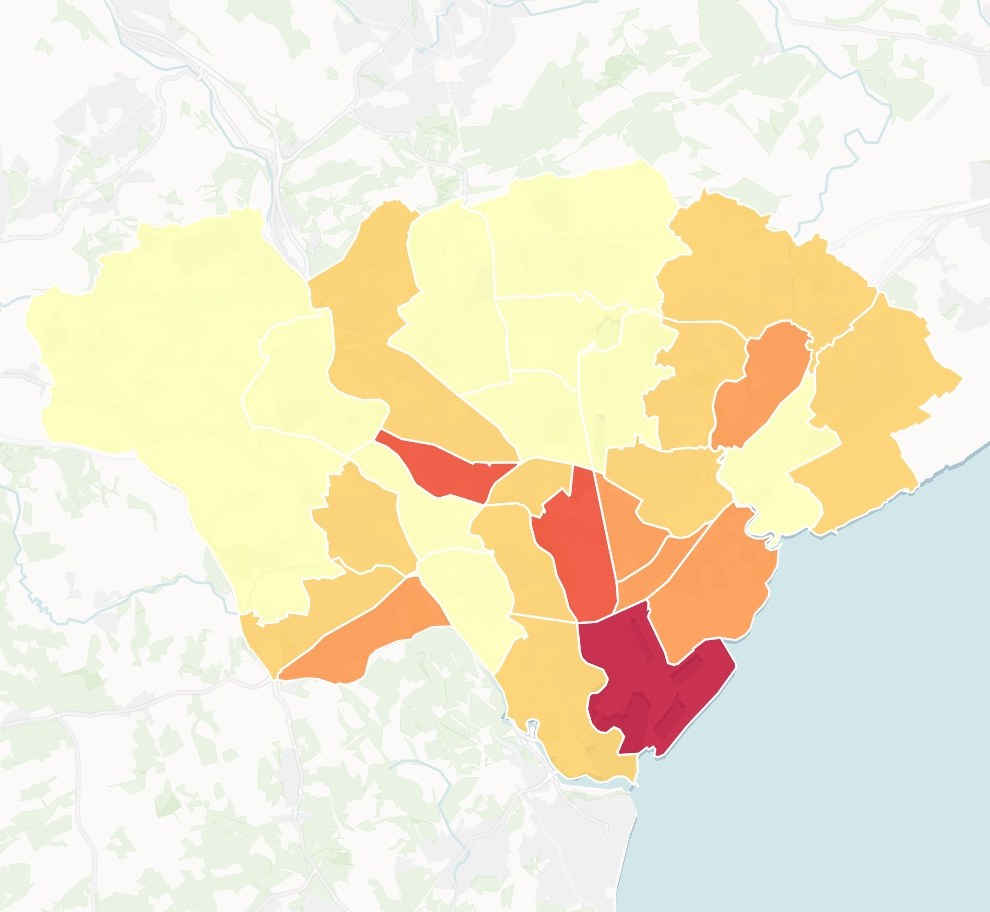
Count the locations inside any area, compare areas on any measure, find the gaps and rank where to build or sell first.
- Or ask
Where is take rate lowest in the areas we passed more than a year ago?
Which areas have the lowest share of locations passed?
Gigabit coverage by area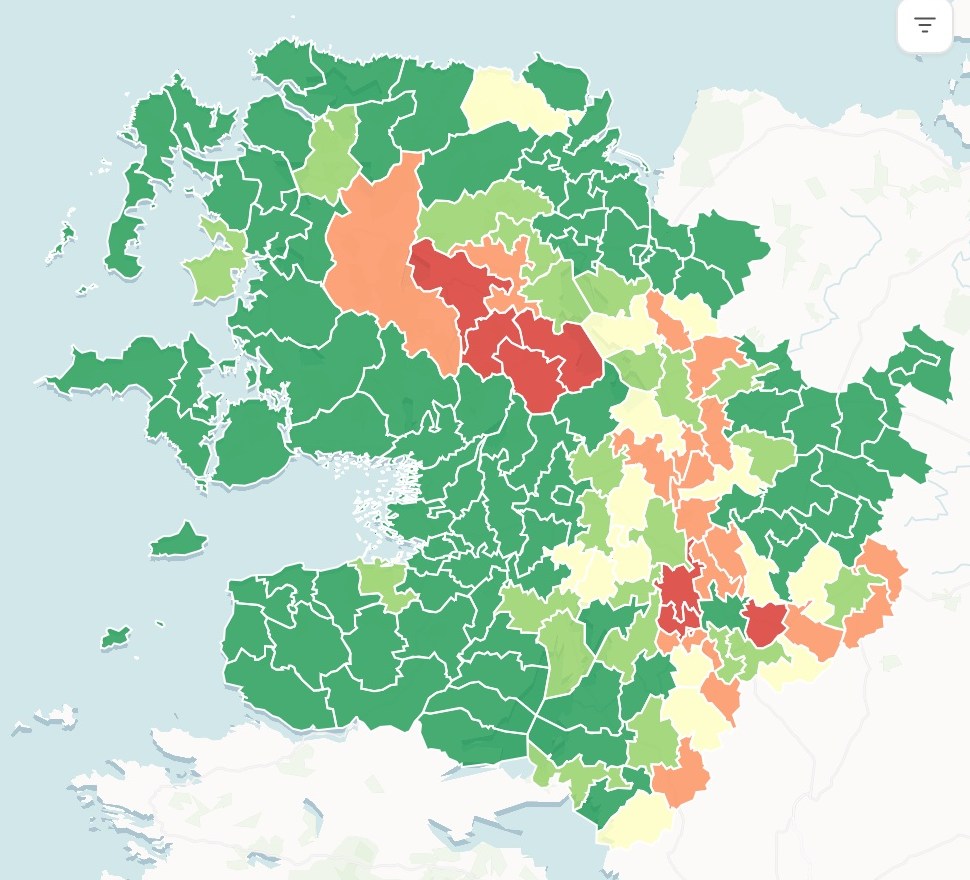
- Or ask
Hand it on in the form the reader expects
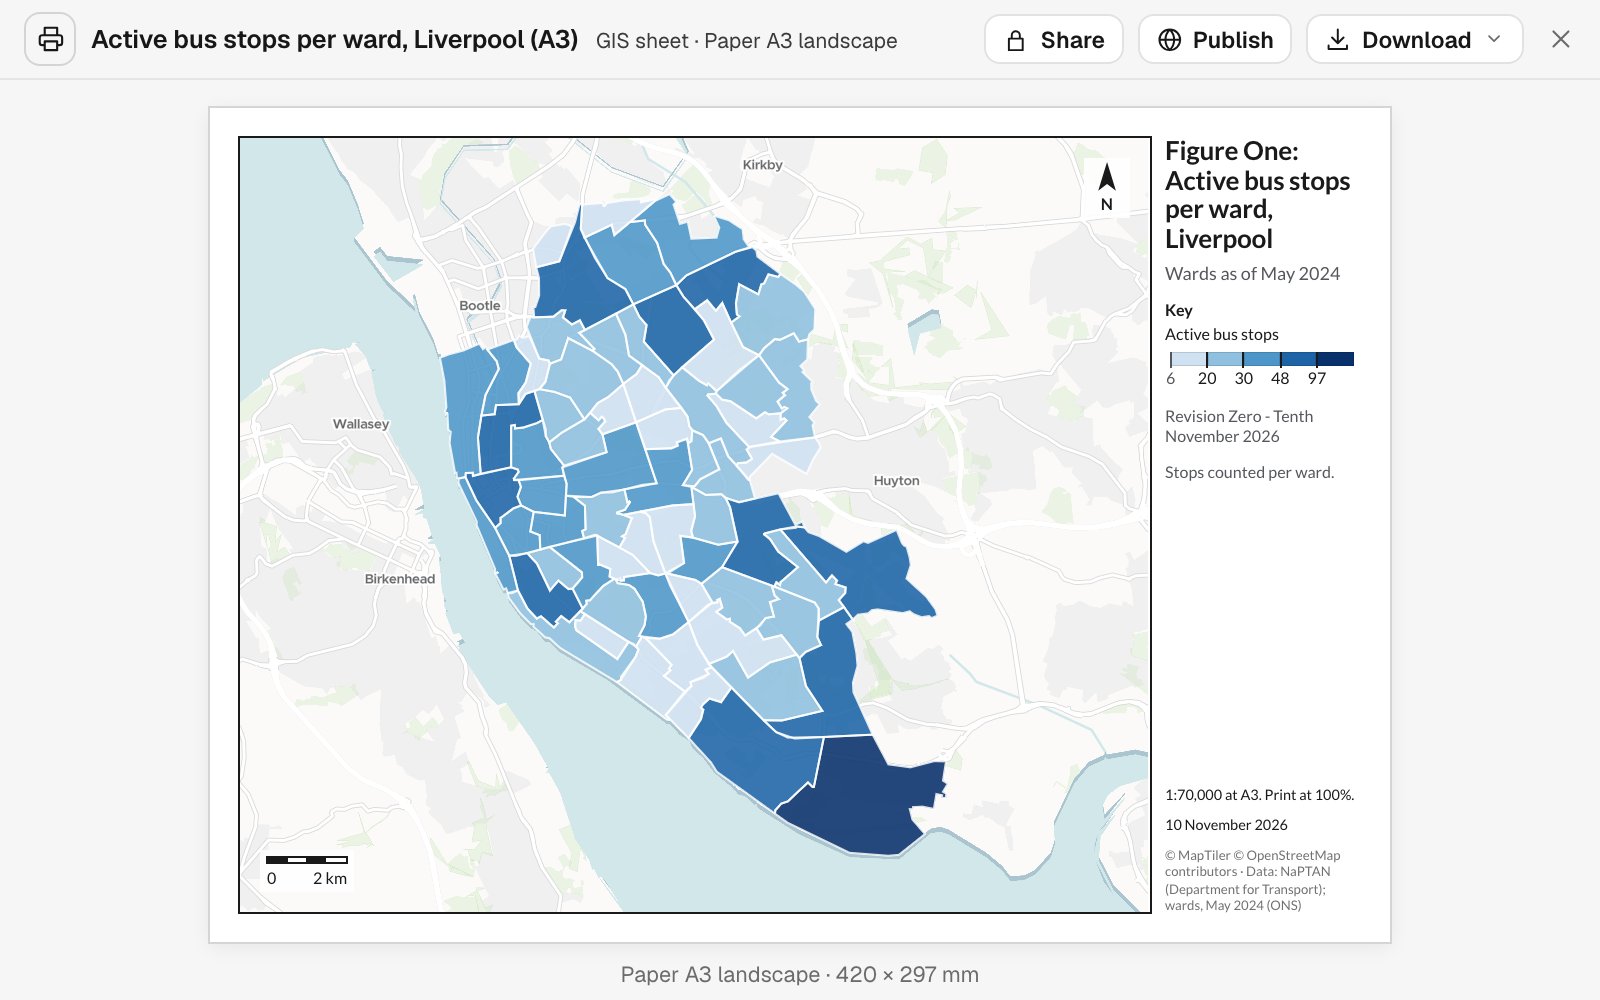
A print sheet to scale, a map people can search, a spreadsheet, a file your GIS opens or a written report. Each carries its sources, its dates and its method.
- Or ask
Give me the list as a spreadsheet, with a column for inside or outside.
Make this a print sheet for the grant application.
- Or ask
Three examples
Three of many, from different corners of broadband. Each shows the request, what came back and who decides.
Door-to-door turfs for the addresses that just went live
The field sales manager at a fiber provider
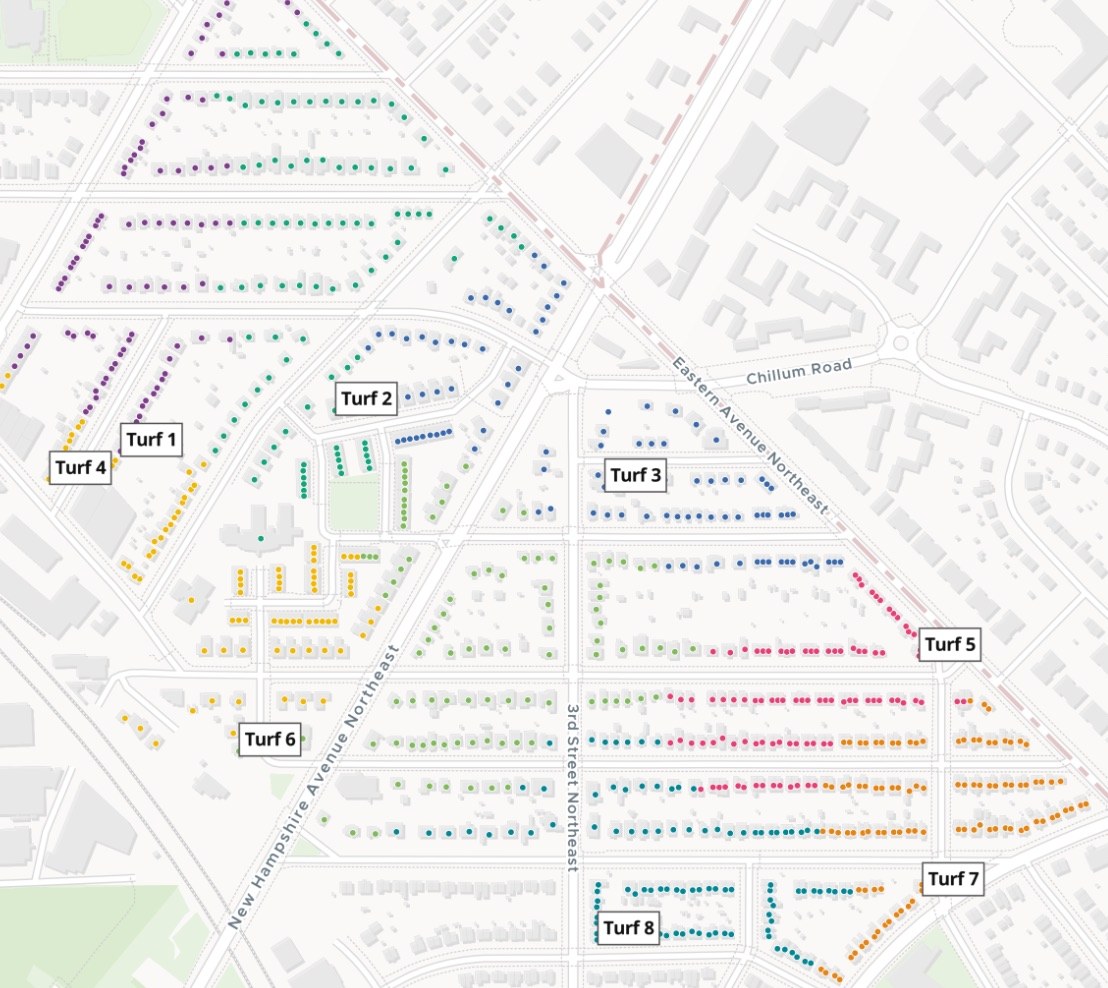
Turfs
Homes, colored by turf
- Eight turfs, 97 to 105 doors each
The request
Attached are the addresses that went live in phase 2. Split them into turfs of about 100 doors each, map them numbered, and give each a walk list.
What came back
- Eight turfs of about 100 doors each, numbered on a map to print
- Every address given its turf
- A walk list for each turf, street by street
Goes toThe canvassers, through the field sales manager.
Mapstack draws the turfs, while you assign them and set the targets.
How many households a candidate market holds
A planner at a regional fiber provider, looking at a market in Ohio
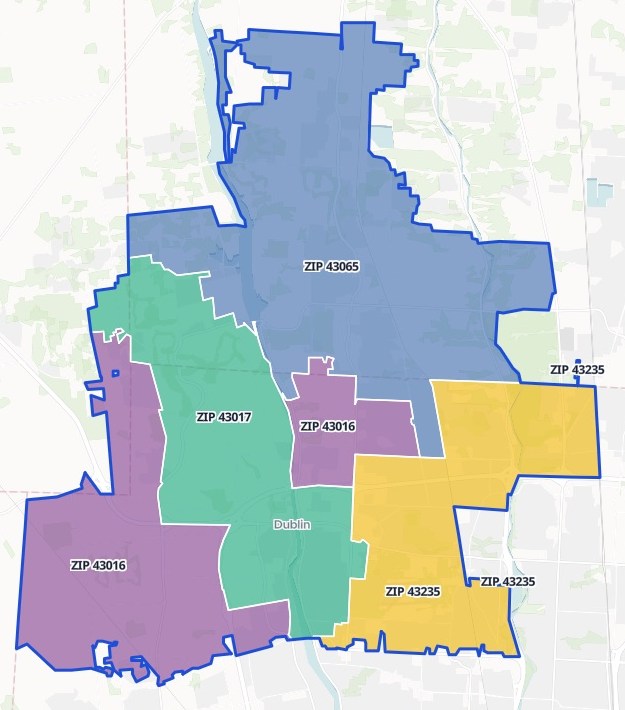
ZIP codes
Outlined together as one area
- 43016
- 43017
- 43065
- 43235
The request
Draw ZIP codes 43016, 43017, 43065 and 43235 as one market. Count the people, households and owner-occupied households in each, from the latest census.
What came back
- The four ZIP codes drawn as one area, each outlined and labeled
- People, households and owner-occupied households, by ZIP code and in total
- The census release named, with its year
Goes toLeadership, beside the build costs you add.
Mapstack counts the market, while you decide whether to build there.
Where older residents live, before the sign-up events
An outreach lead at a county broadband office, with no GIS training
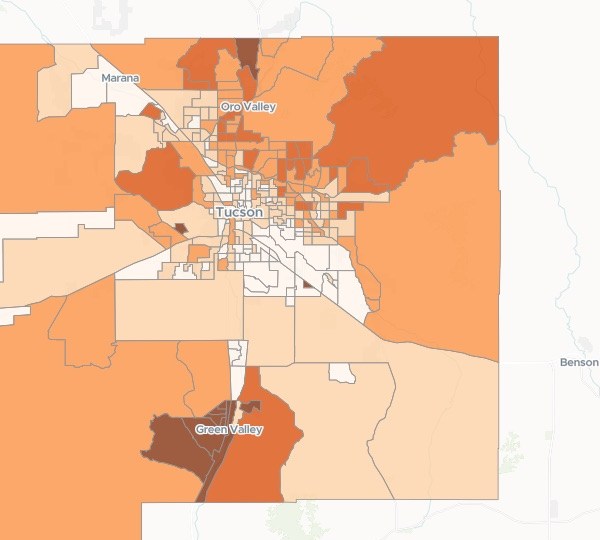
Census tracts
Share aged 65 and over
- 65.6% and above
- 35.6% – 65.6%
- 23.3% – 35.6%
- 13.3% – 23.3%
- Below 13.3%
The request
Show where people 65 and over live across our county: how many, and what share of each census tract. Use the latest census. We are choosing where to hold sign-up events.
What came back
- Every census tract shaded by its share of residents 65 and over
- The count and the share for each census tract, ranked
- A note on the census table used and its year
Goes toThe office’s outreach plan.
Mapstack counts and maps the residents, while the office decides where the events go.
An example of how it goes
Four teams asked on Monday. None of them waited.
Dana is the GIS analyst at a regional fiber provider, and she keeps the network records too. On Monday morning regulatory, field sales, construction and finance each have a request in.
- serviceable-addresses.csv
Put our serviceable addresses on the map and pick out the records that need checking before we match them to the official list.
Monday 8:30
Regulatory asks first
One sentence and the address file. Dana hands it to Mapstack and opens the next request.
- A town’s address register, by kind of site
Monday 8:50
The addresses are back
Every address placed, with the records that need a second look picked out.
- Eight turfs, numbered
Split the addresses that went live on Friday into turfs of about 100 doors.
Monday 9:15
Field sales is next
A different question, asked the same way. Construction asks what a route crosses, and finance asks for take rate by area.
- Eight turfs, numberedBack with their owners
Four requests, four teams
Each checked by Dana and passed to the person who decides
Monday 11:40
The owners take over
The regulatory lead, the sales manager, the permitting coordinator and finance each check what came back and make their own call.
Dana cleared Monday’s queue on Monday.
She checked each result and passed it on. The teams got their answers while the questions were still live, and she spent the afternoon on the records only she looks after.
Works beside your network records
Your network inventory and your GIS stay the record. Mapstack works on the addresses, areas and lists around them.
- What you bringExports from the systems you run today.
- Serviceable and passed addressesThe official location list you licenseCustomer and billing addressesProject areas and build phasesLast period’s list
- What Mapstack finds for youPublished data, fetched when you ask and named on the result.
- Census households and populationCounties, tracts and ZIP codesPlaces and businessesOpen data from public agencies
- What you hand onIn the form the reader expects.
- A list with what did not matchCounts and maps by areaPrint sheets, to scaleSpreadsheets and files your GIS opensA map people can search
Made to be signed by you
What a provider or a broadband office hands over can be challenged. So nothing here is taken on trust.

- Mapstack does not design the network. No route or splice design, no make-ready engineering and no propagation modeling. It is not your network inventory, and it does not run outage maps or crew apps.
- You certify and submit. Mapstack does not file a return, a challenge or a grant report. It prepares the list and the counts for the person who signs.
- What did not match is listed, not dropped. Both sides of a match are counted, so nothing disappears quietly.
- Sources, dates and method on every result. Which list, which census, which boundary and when each was current. Ask for the same method next period and it is repeated.
- Bring your own location data. Mapstack does not supply the official location list or other licensed data. It works from your copy, which stays private to your workspace.
The parts of Mapstack broadband teams use most
One teammate, whichever team is asking.
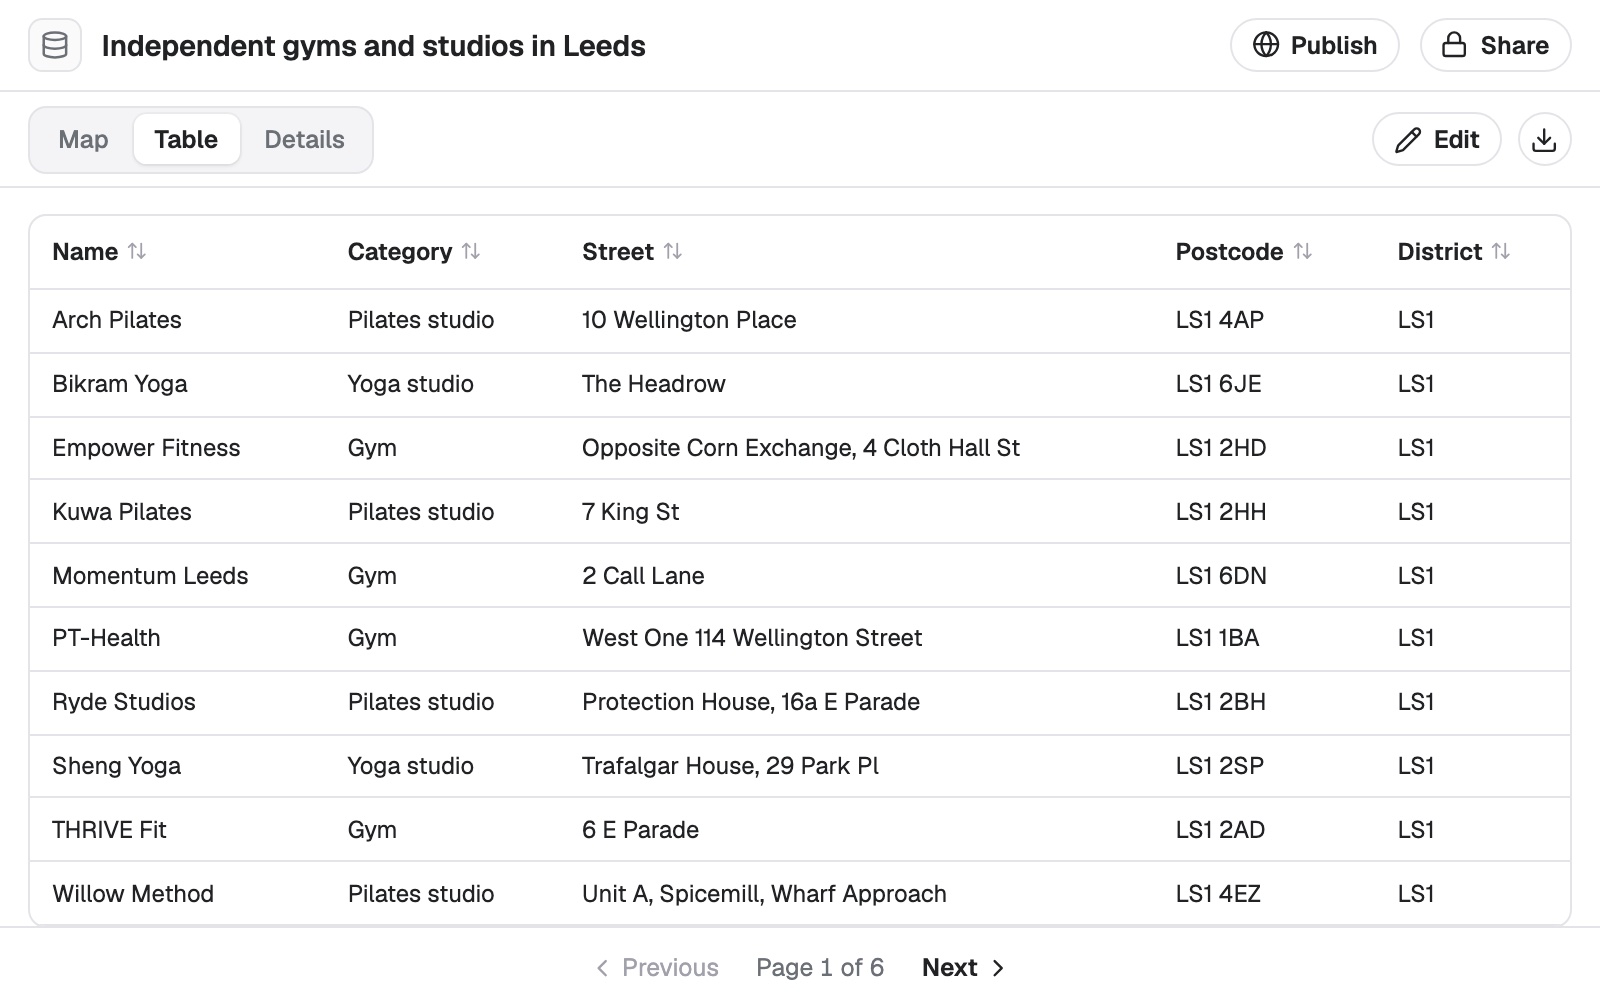
Data
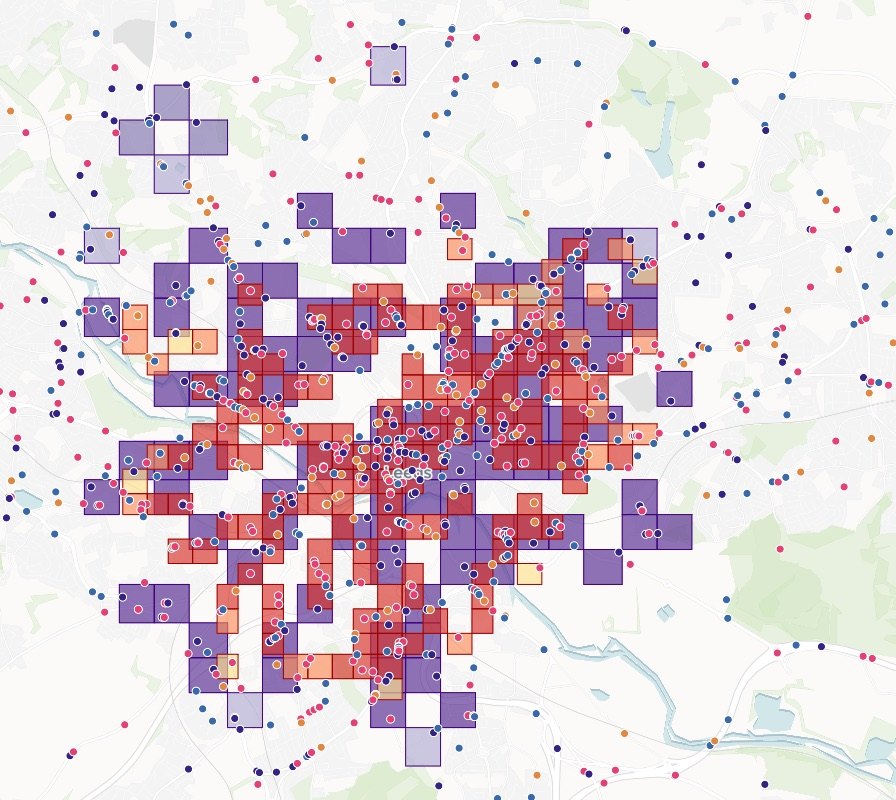
Address lists cleaned, placed and matched.
Analysis
What is inside an area, and where the gaps are.
Reports and print maps
Print sheets and written reports, with sources.
Automation
The same counts, rerun on next period’s list.
Looking for a particular job? These go step by step.
- Find the areas a service has not reachedCoverage by area, and the gap left after planned build.
- Check which addresses fall inside your areaInside or outside on every row of your list, counted and mapped.
- Check an address register before it goes outDuplicates, zero house numbers and ZIP codes checked, and a map to search by address.
- Put coordinates on every address in a listLatitude, longitude and how precisely each matched, in your own file.
- Join two tables, and see what did not matchMatched on a shared ID, counted on both sides.
- Add the area to every row of your listWhich area each place is in, counted and ranked.
- Split addresses into canvass turfsDoor-knocking patches of the size you ask, each with a walk list.
- Split accounts into fair sales territoriesEven territories from your account list, drawn on a map.
- Draw a franchise territory and count what it holdsZIP codes as one protected area, its households against your standard.
- Map where the people you want to reach liveHow many in each area, and what share, from the census.
- List everything a proposed route crossesEvery road, railway, river and pipeline, in order, with where and how far along.
- Re-run last month's analysis on new figuresThe same method, the new map, and what moved.
What it costs
Mapstack is priced per person and free to start, with no minimum and no sales call.
Free
$0for one person
Ask about your own files. What comes back stays private to you until you choose to share it.
Creator
$16a person a month, billed yearly
Adds sharing with your team, reports and print sheets, and work that reruns without you.
Creator Max
$80a person a month, billed yearly
The same, with a larger monthly allowance for people who ask all day.
Colleagues who only need the answers take a Viewer seat at $10 a month. They open every result and ask it their own questions. See every plan.
Questions broadband staff ask
What GIS work can Mapstack do for a broadband provider?
Most of what the business asks a GIS analyst for: maps, spatial analysis, lists of what falls inside an area, cleaned and matched address data, print sheets, small apps and written reports. You ask in plain words or in GIS terms, and your staff check the result.
Is it only for GIS staff?
No. It is for the people who do the location work and for the staff who wait on them, in sales, regulatory, construction, finance or a broadband office.
Do we have to replace our GIS or our network inventory?
No. Mapstack reads the standard formats they export and hands data back in formats they open. Your network records stay where they are.
Does Mapstack do network design or propagation modeling?
No. It works with addresses, areas and lists, and it can map and analyze the output of your own engineering tools.
Does it come with the official location data?
No. Bring the copy you license. Mapstack can find published data such as census counts and boundaries, and it names the source on the result.
How do I match our addresses to the Fabric’s Location IDs?
Attach your serviceable addresses and your copy of the Fabric. Mapstack matches them on a shared ID or on the address, counts both sides and lists what did not match. You work through the exceptions.
Can it prepare a BDC filing?
It prepares the location list and the counts and maps that go with it, and can compare them with last period’s. Checking the format, certifying and submitting are yours.
Can it count eligible locations in a BEAD project area?
Yes. Attach the project area and your eligible locations list, and it counts and maps the locations inside. It can rerun the count when the area or the list changes.
Can it work out take rate by area?
Yes. Give it the addresses you pass and your active customers, and ask for take rate by the areas you choose, as a table and a map.
Can it draw door-to-door territories?
Yes. Give it the addresses that are live and the size of turf you want. It returns numbered turfs on a map to print and a walk list for each.
Can it list what a fiber route crosses, for permits?
Yes. Attach the route and ask for everything it crosses. It returns the roads, railroads, rivers and pipelines in order along the route, as a table and a map.
We are a UK provider. Does it work with UPRNs?
Yes. A list keyed on UPRN joins to another list on that ID like any other, with both sides counted. Checking a return against the template and signing it off remain yours.
Is the data I upload private?
Yes, on every plan, Free included. Your files and everything made from them are private to your workspace by default. Nothing is public unless you choose to publish it, and you can make it private again.
What happens to my data?
It stays in your workspace and it stays yours. Only the people you give a seat to can see it. It is stored in the United States, it is not used to train AI, and when you delete it, it is removed.
Ask the question you are waiting on.
Free to start. No card.