
Redistricting
Draw a balanced redistricting plan to compare.
Attach your current district lines. You get each district measured against an equal share of the census population, and a balanced test plan with today's lines over it.
Free to start. Written reports on a paid seat.
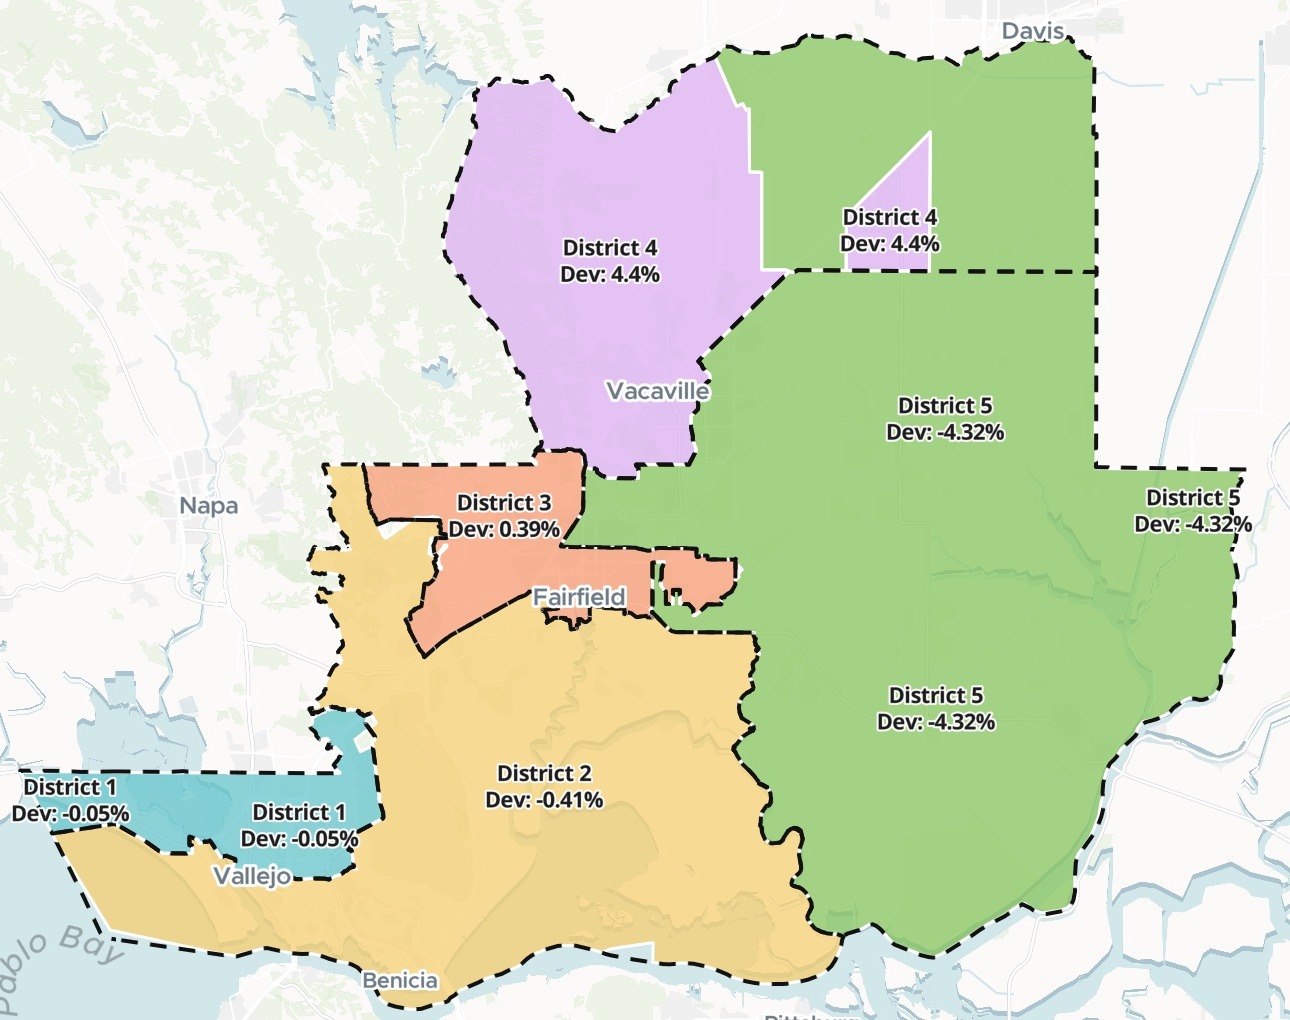
| New test plan | People | From the ideal |
|---|---|---|
| District 1 | 90,631 | −0.05% |
| District 2 | 90,309 | −0.41% |
| District 3 | 91,031 | +0.39% |
| District 4 | 94,669 | +4.40% |
| District 5 | 86,759 | −4.32% |
A test plan to compare with today's lines, not adopted districts.
For whoever prepares the redistricting
A new census lands.The board will redraw its districts.
Before the first hearing, someone has to know how far today’s lines have drifted, and what a balanced set could look like.
It starts with arithmetic. Share the people equally between the seats and you have the ideal population. Every district is measured by how far it sits from it.
Here you attach the lines you have. Mapstack fetches the census counts, tests your districts and draws a test plan beside them: a starting point for the people who decide, not districts anyone has adopted.
One real county
Two of five districts outside 5%
Solano County, California, elects a board of five supervisors. We attached its 2021 supervisor districts. Mapstack fetched the 2020 Census count for every census block, the smallest area the census counts, and added up the people inside each district.
- Spread today
- 12.35%from the fullest district to the emptiest: the total deviation
- Ideal
- 90,680people a district: the county’s 453,399, split five ways
- Within half a percent
- 3 of 5districts: 1, 2 and 3
| Today’s districts: 2021 lines | From the ideal | People |
|---|---|---|
| District 1 | −0.09% | 90,603 |
| District 2 | −0.36% | 90,350 |
| District 3 | +0.46% | 91,101 |
| District 4 | +6.16% | 96,267 |
| District 5 | −6.19% | 85,070 |
The drift is in the east.
District 4 holds 5,587 more people than the ideal and District 5 holds 5,610 fewer.
Solano County Department of Information Technology GIS, Board of Supervisors District Boundaries 2021 (ArcGIS Hub). US Census Bureau, 2020 Census population by census block, fetched by Mapstack. Run on 15 November 2026.
Ask for a tidier shape
Say what looks wrong, and which rule must still hold.
A tidier shape can cost some balance. Both plans’ tables stay in your session, so they can be weighed side by side.
District 5 reaches Dixon through a thin strip. Make the plan more compact there while keeping every district within 5%.
The first plan held every district within 1.5% of the ideal, a total deviation of 2.83%, but reached Dixon by a thin strip. Mapstack redrew it so District 5 reaches Dixon across the farmland to the north. Every district stayed within 5%, and the total deviation widened to 8.72%.
Population balance, and communities kept together
You set the rules in the request. These are the ones this plan was drawn to.
Equal shares of people
Each district close to the ideal, and inside the limit you set.
Cities kept whole
Benicia, Suisun City, Dixon and Rio Vista each sit in one district. Vallejo, Fairfield and Vacaville, each bigger than a district, are shared.
Today’s lines on top
The current districts are drawn dashed over the new ones, so everyone can see what would move.
How it goes
You bring the lines. Mapstack brings the census.
Attach your current districts and set the rules.
Mapstack draws a test plan from the census.
You get the tables to check.
Common questions
Is this a final plan?
No, a test plan. A starting point to set beside today’s lines, for the people who decide.
Drawn on census counts. Balanced on population, with cities kept together where the numbers allow.
Yours to change. Ask for a line moved, and the map and the table are redrawn.
What does it cost?
Free to start. One seat, for you, with a starter amount of work each month. No card.
The plan, the tables and the map are on the free seat. With your own files and public sharing.
Written reports are on a paid seat. Paid seats are per person, and bring more work each month.
The prices are on the pricing page.
What happens to our district files?
It stays in your workspace. Only people with a seat in your workspace can see it. Nothing leaves unless you publish it yourself.
It is not used to train AI. Your data and your conversations are not used to train AI models.
It is still yours. You keep ownership of what you bring in. Delete it and it is removed.
The full answer is in the documentation: Your data, privacy and security.
Test your lines.
Free to start. Written reports on a paid seat.