
Catastrophe event response
See which of your sites the storm hit.
Attach the storm's wind map and your list of sites. You get each site's strongest wind on a map, and a call list for welfare checks, strongest wind first.
Free to start. No card.
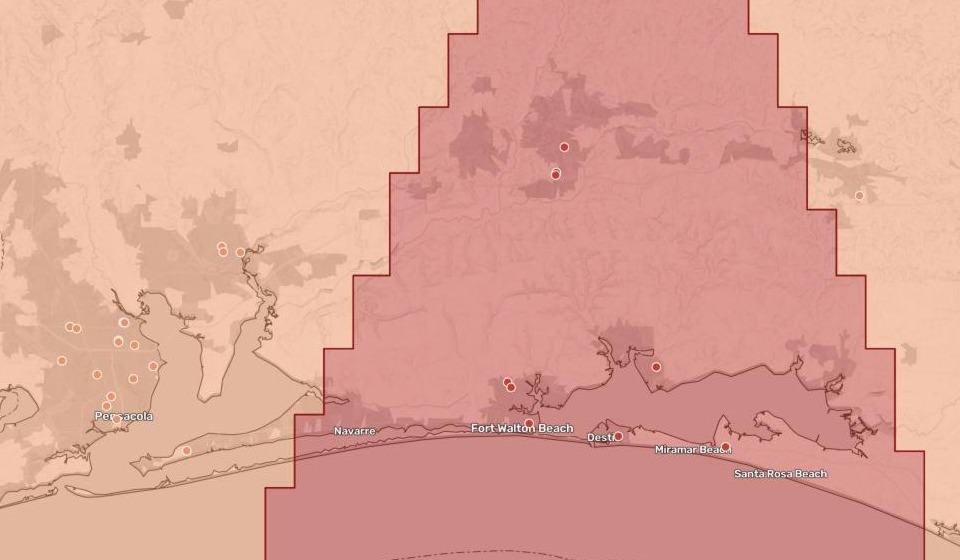
| Strongest wind at each home | Homes |
|---|---|
| Hurricane force, 74+ mph | 11 |
| 50 knots, 58–73 mph | 31 |
The hurricane-force homes sit in the red core, around Fort Walton Beach and inland.
For whoever checks on every site after a storm
Care homes.Clinics.Schools.Branches.
When the storm has passed, the first question is which of yours were in it, and how hard it hit.
After a hurricane, the National Hurricane Center publishes a wind swath: a map of where its winds reached tropical-storm strength, 50 knots and hurricane force. Turning that map into who to ring first is where catastrophe event response starts.
Here you attach the wind map and your list. Mapstack checks every site against it, adds up the totals, writes the call list and maps them.
One real storm
29,515 certified beds in the storm’s path
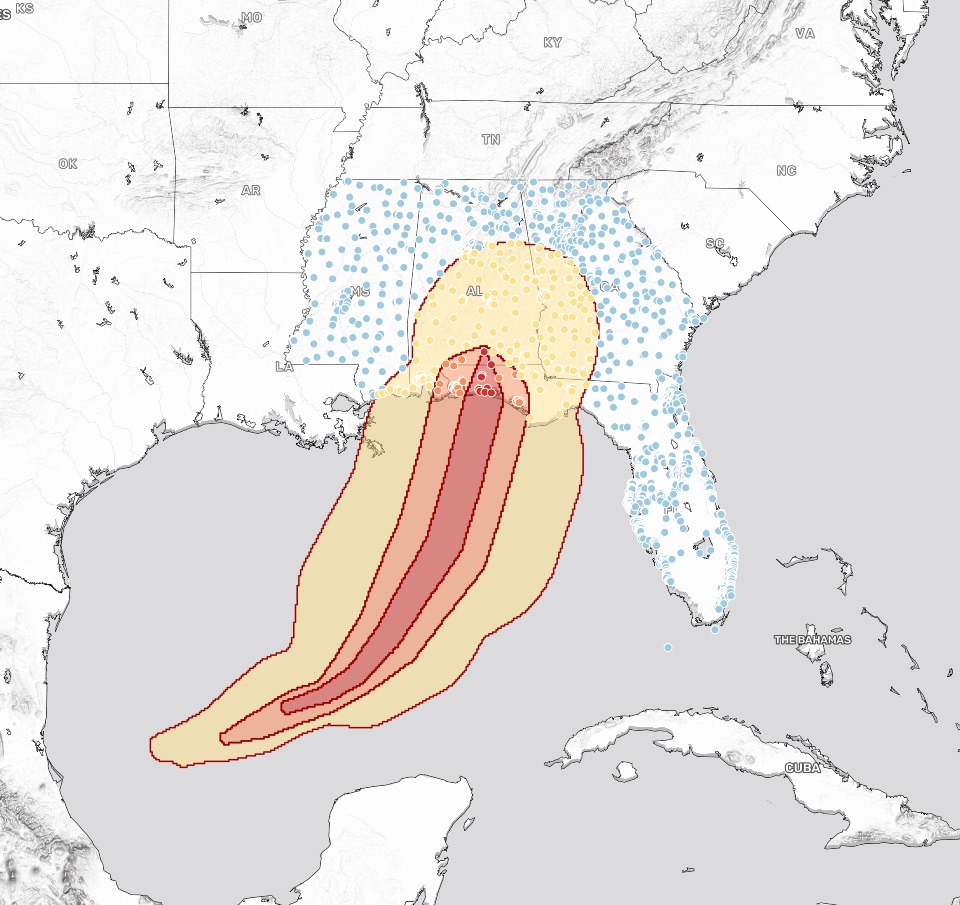
Hurricane Isaias came ashore near Fort Walton Beach, Florida, on 10 October 2026. Its wind map, against every Medicare and Medicaid certified nursing home in Florida, Alabama, Georgia and Mississippi.
- Top of the list
- Crestviewthe town of the hurricane-force home with the most residents
- Hit hardest
- Okaloosathe Florida county with 8 of the hurricane-force homes
- Inside the storm
- 256of the 1,476 homes checked, each in its strongest wind
| Strongest wind | Certified beds |
|---|---|
| Hurricane force | 1,235 |
| 50 knots | 3,804 |
| Tropical storm force | 24,476 |
The call list, strongest wind first.
The 42 homes in the hurricane-force and 50-knot bands, in order of wind and then residents, each with its city, county, beds and phone number.
National Hurricane Center (NOAA), best track wind swath for Hurricane Isaias, AL092026. Centers for Medicare & Medicaid Services, Care Compare nursing home provider information, October 2026. Run on 15 November 2026.
The whole storm, and every home in the four states
- The wind bands as published. Three areas from the National Hurricane Center, nested from the edge of the storm to its core.
- Every home in one colour. Blue outside, then yellow, orange and red as the wind grew.
- Search, pop-ups and a table. Find a home by name; its beds, residents and phone number are in its pop-up.
How it goes
You bring the wind map and the list. Mapstack does the rest.
Attach the wind map and your list and say what you need.
Mapstack places every home in the strongest band it was in.
You get the call list.
Common questions
What happens to our site list?
It stays in your workspace. Only people with a seat in your workspace can see it. Nothing leaves unless you publish it yourself.
It is not used to train AI. Your data and your conversations are not used to train AI models.
It is still yours. You keep ownership of what you bring in. Delete it and it is removed.
The full answer is in the documentation: Your data, privacy and security.
What does it cost?
Free to start. One seat, for you, with a starter amount of work each month. No card.
This job is on the free seat. Maps, datasets, analysis, your own files and public sharing are all included.
Pay per person for more. A paid seat brings more work each month, and seats for your team.
The prices are on the pricing page.
How is each site counted?
Once, in its strongest wind. The wind areas overlap. A site inside all three counts only in the hurricane-force band.
From your own columns. Whatever number your list holds, such as beds, is added up for each band.
Where your file puts it. Each site is placed from the coordinates in your list.
Check your sites.
Free to start. No card.