
Hot spot analysis and crime mapping
Find where incidents really cluster.
Attach a list of incidents with their locations. You get a map of the hot and cold spots that are more than chance, with the method written down.
Free to start. No card.
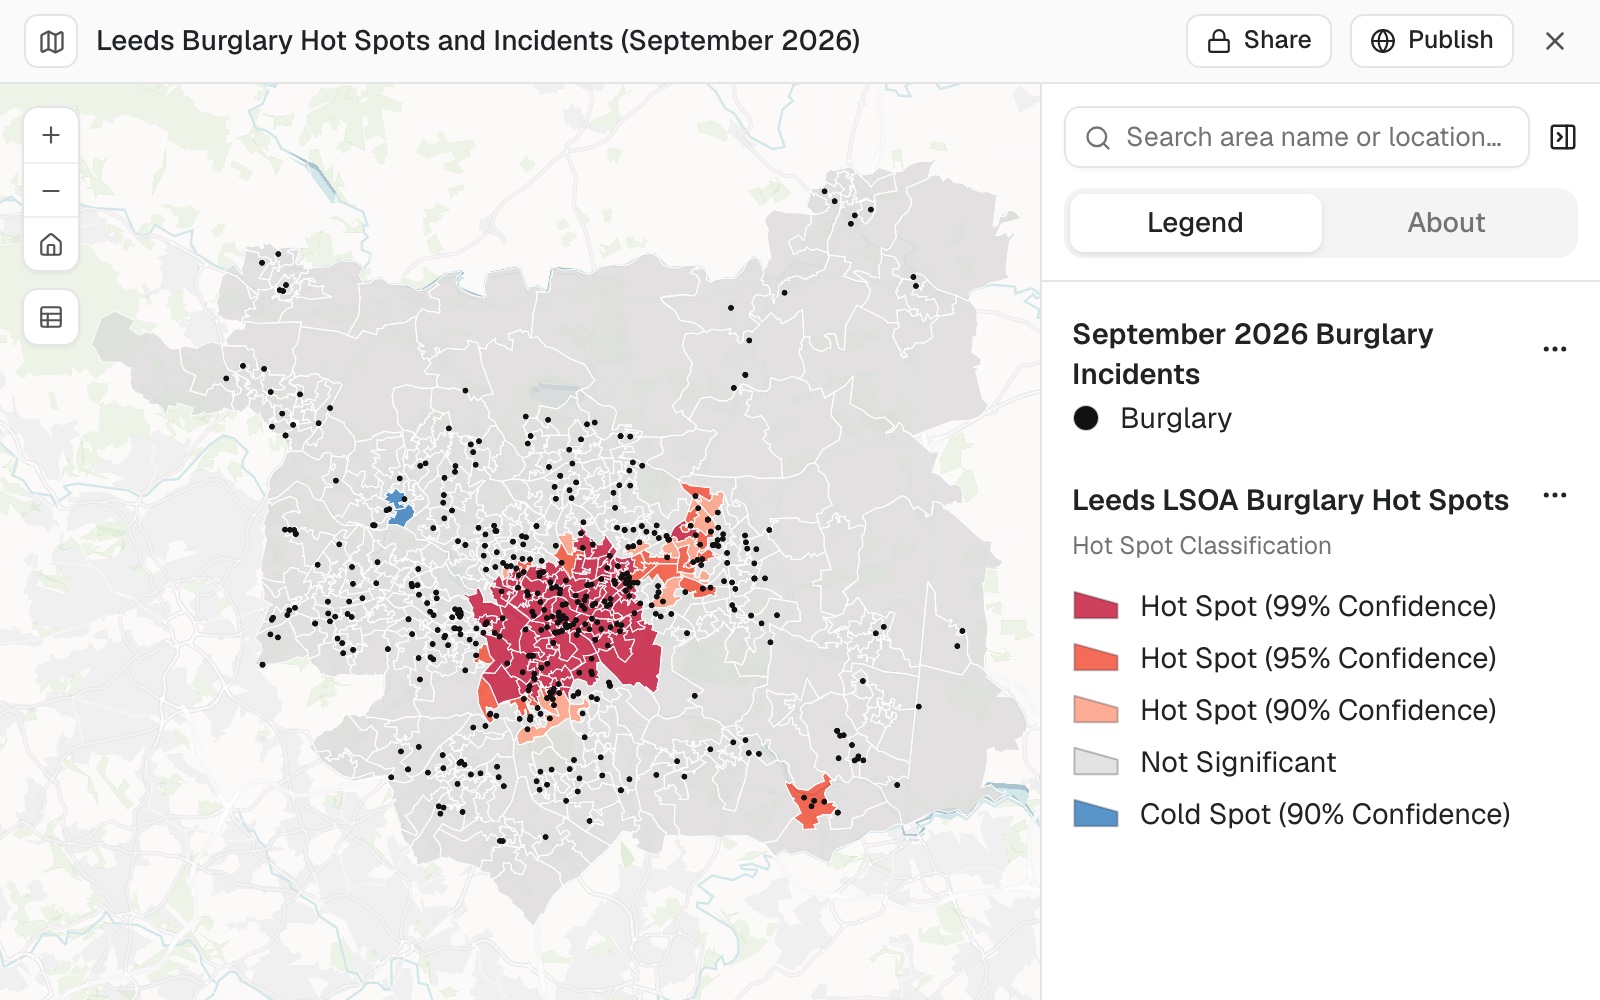
| Result | Areas |
|---|---|
| Hot spot, 99% confidence | 75 |
| Hot spot, 95% | 18 |
| Hot spot, 90% | 12 |
| Not significant | 381 |
| Cold spot, 90% | 2 |
105 of 488 areas came out as significant hot spots.
For whoever gets asked where the problem is
A heat map shows where things happened.It does not show where they cluster more than chance.
Someone will ask you to tell the difference.
Dots pile up wherever people live, so a busy area looks bad on any map.
A hot spot analysis compares each area with its neighbours on a rate, and reports which clusters hold up.
One real analysis
508 burglaries, 488 areas, 105 hot spots
One month of street-level crime from police.uk for Leeds and the area around it: 16,962 records, of which 508 were burglaries inside the district.
- The incidents
- 508burglaries inside the Leeds district, September 2026
- The areas
- 488small census areas, each with its households from Census 2021
- The neighbourhood
- 2,911 mhow far "neighbours" reaches: the distance at which the clustering is strongest
- Hot spot, 99% confidence
- 75
- Hot spot, 95%
- 18
- Hot spot, 90%
- 12
- Cold spot, 90%
- 2
- Not significant
- 381
A hot spot is a cluster, not a single bad street.
An area with no burglaries at all can be a hot spot when its neighbours have high rates: three of the ten strongest had none. For patrol or prevention planning that is the point. The cluster is the unit.
Crime: police.uk street-level data, September 2026, which moves each crime to a nearby point on a street. Households: Census 2021. Run on 11 November 2026.
How it goes
You say what to count and what to divide by. Mapstack does the statistics, and says what it did.
Attach your incidents and say what to count.
Mapstack works out the rate and tests every area against its neighbours.
You get the map and the method, ready for a briefing.
The step-by-step guide is in the documentation: Find where incidents cluster: a hot spot map.
One month is where it starts
The same request stretches further. Each of these is something you can ask for today.
Change what is counted
Another incident type, another population to divide by.
- Do the same for vehicle crime.
- Use incidents per 1,000 residents, not households.
- List the ten areas with the highest rates.
Compare over time
The same test, month after month.
- Run it again for October with the same neighbour distance.
Then brief it
The map is for someone: a commander, a committee, a partnership.
- Make the burglary points small and black so they don't hide the hot spots.
- Give me the method in a paragraph I can paste into the briefing.
Common questions
What happens to my incident data?
It stays in your workspace. Only people with a seat in your workspace can see it. Nothing leaves unless you publish it yourself.
It is not used to train AI. Your data and your conversations are not used to train AI models.
It is still yours. You keep ownership of what you bring in. Delete it and it is removed.
The full answer is in the documentation: Your data, privacy and security.
What does it cost?
Free to start. One seat, for you, with a starter amount of work each month. No card.
This job is on the free seat. Maps, datasets, analysis, your own files and public sharing are all included.
Pay per person for more. A paid seat brings more work each month, and seats for your team.
The prices are on the pricing page.
What is the method?
A rate, not a count. Incidents are divided by households or residents, from the census.
Each area against its neighbours. The test is Getis-Ord Gi*, the standard hot spot statistic, at the distance where the clustering is strongest.
Corrected for luck. A false discovery rate correction, because hundreds of areas are tested at once.
All of it reported. The distance used, the counts at each confidence level, and the strongest areas.
Find yours.
Free to start. No card.