
Pipeline consequence areas
See what lies near your pipeline, mile by mile.
Attach the line. You get the people, homes, water, wellhead protection areas and preserves near each one-mile stretch, and the stretches that matter most.
Free to start. Reports and prints on a paid seat.
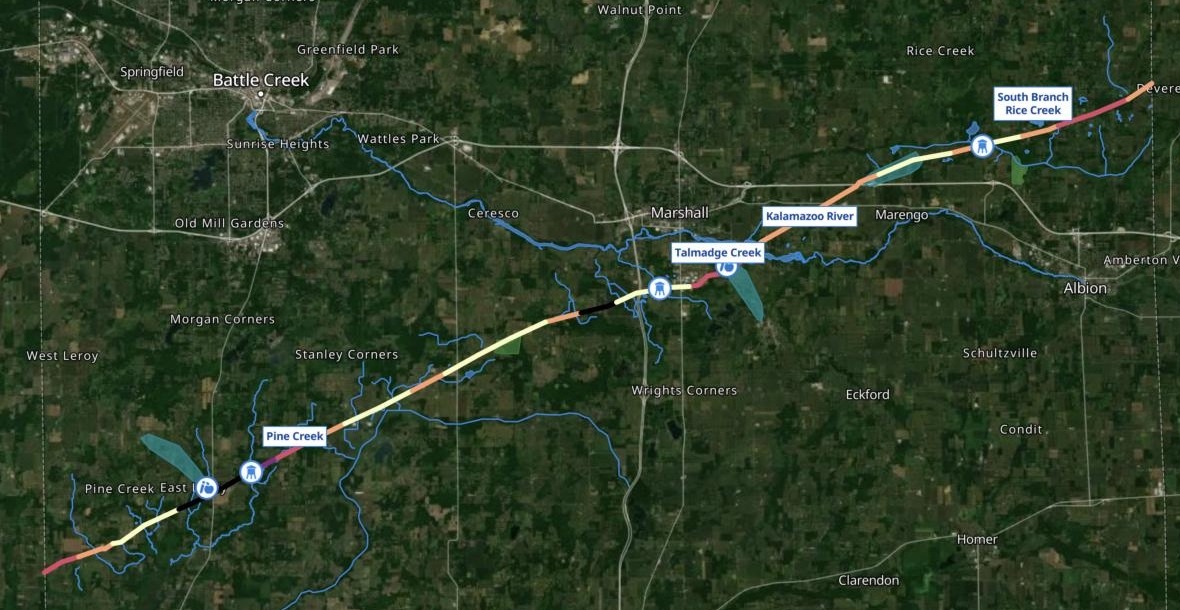
| People within 660 feet | Stretches |
|---|---|
| 37.5 and above | 3 |
| 32.3 to 37.5 | 1 |
| 18.9 to 32.3 | 6 |
| 13.5 to 18.9 | 11 |
| Below 13.5 | 12 |
| Rivers and streams | |
| Wellhead protection areas | |
| Protected land |
The four named crossings are labelled.
For whoever plans for the pipeline in their county
A pipeline crosses your county.
The plan has to say where a leak or rupture would reach people, water and protected land, stretch by stretch.
In pipeline safety, the places where a release would do the most harm are called consequence areas. The first screen for them measures what lies within a set distance of every part of the line.
A wellhead protection area is the land that feeds a public water well. Here you attach the line, and Mapstack brings in the census, the water, the wellhead protection areas and the protected land for you.
One real line
A crude oil line, checked one mile at a time
A crude oil line across Calhoun County, Michigan, from one county line to the other, taken from OpenStreetMap. Every stretch got its people, homes, water and protected land.
- Most people
- East Leroymile 5, south of Battle Creek: the most within 660 feet anywhere on the line
- Preserve
- Miles 13–15within half a mile of Jenny Woods Nature Preserve
- Matters most
- Marshalltwo of the four stretches that matter most, east and south of the town
| Stretch | People within 660 feet | Homes |
|---|---|---|
| Mile 5, East Leroy | 40 | 18 |
| Mile 7, Pine Creek | 32 | 12 |
| Mile 10, the fewest | 7 | 3 |
| Mile 17, southwest Marshall | 39 | 18 |
| Mile 21, the Kalamazoo River | 25 | 9 |
| Mile 28, South Branch Rice Creek | 14 | 4 |
It ranks the stretches that matter most, and says why.
Two are at Marshall. The others are south of Battle Creek, where the most people live, and northwest of Albion, where the line crosses South Branch Rice Creek. Each comes with its nearest road.
OpenStreetMap contributors: the pipeline, cut at the Calhoun County line, as of 15 November 2026. US Census Bureau, 2020 Census blocks: people and homes. Michigan EGLE: wellhead protection areas. Run on 15 November 2026.
Closer in at Marshall
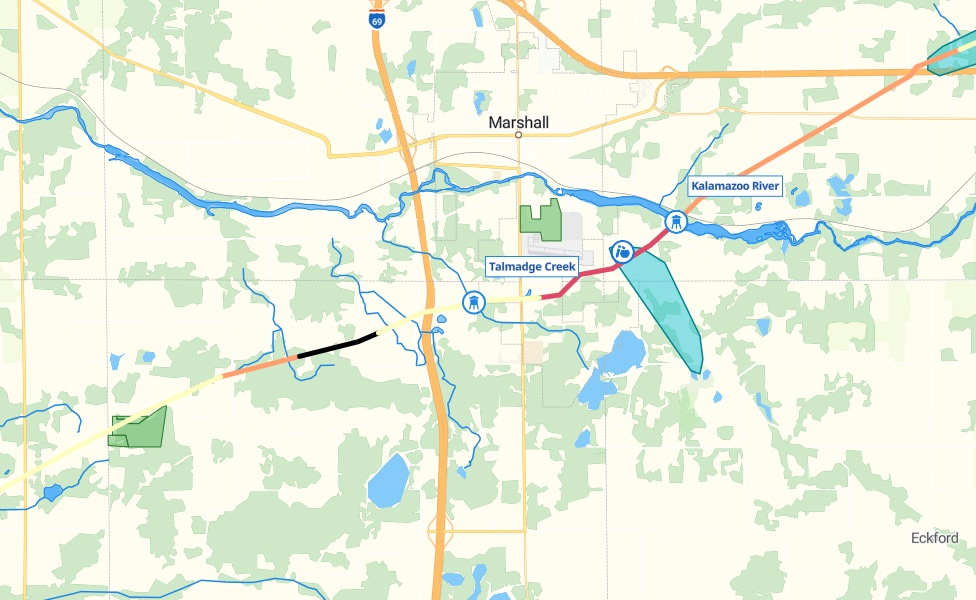
Where a leak would reach the most at once: homes, a creek, a river and a school’s water.
- Southwest of Marshall, mile 17. The black stretch, by Old US-27: almost as many people as mile 5.
- Talmadge Creek, mile 19. Crossed south of the town. The creek runs into the Kalamazoo River.
- The Kalamazoo River, mile 21. Crossed east of the town, with Marshall Academy within 660 feet and inside the school’s wellhead protection area.
Keep the map to what the line could reach
Ask for the half-mile corridor, and the map is ready for the plan.
The county-wide layers stay in the session, as datasets of their own.
Show only the schools, care homes, rivers, streams, lakes, wellhead protection areas and protected land within half a mile of the pipeline, not the whole county. Colour the stretches by how many people live within 660 feet, and label the named river and creek crossings.
Mapstack kept only what lies within half a mile, shaded the stretches from pale to dark by the people within 660 feet, and labelled the named crossings, giving the mile of each.
How it goes
You bring the line. Mapstack brings the rest.
Attach the line and give the two distances.
Mapstack checks every mile and shades it by the people nearby.
You get the table, a row a mile, to download.
Then take it into the plan
The same stretches, for the people who act on them.
A printable map
For the plan, and the meeting about it.
- Make a printable map of the pipeline stretches and what they could reach, for our hazard mitigation plan.
A written section
The table, the stretches that matter most and the map, in one report.
- Write a report for the pipeline section of our hazard mitigation plan: the stretch table, the stretches that matter most and why, and the map.
A link to send
The same map, for the fire departments along the line.
- Publish the map so the fire departments along the line can open it from a link.
Common questions
What happens to our pipeline file?
It stays in your workspace. Only people with a seat in your workspace can see it. Nothing leaves unless you publish it yourself.
It is not used to train AI. Your data and your conversations are not used to train AI models.
It is still yours. You keep ownership of what you bring in. Delete it and it is removed.
The full answer is in the documentation: Your data, privacy and security.
What does it cost?
Free to start. One seat, for you, with a starter amount of work each month. No card.
The stretch table, the map and the download are on the free seat. With your own files and public sharing.
A printable map or a written report is on a paid seat. Paid seats are per person, and bring more work each month.
The prices are on the pricing page.
Where do the figures come from?
People and homes. From the 2020 census blocks, shared out to the 660-foot band around each mile.
Water and protected land. The county’s rivers, streams, lakes, parks and preserves, found by Mapstack.
Drinking water. The state’s wellhead protection areas, each by name.
Check your line.
Free to start. Reports and prints on a paid seat.