
Evidence of need for a grant bid
Write the evidence of need for your funding bid.
Attach the official figures for your area. You get the evidence of need as a report a funder will read, with maps and its sources cited.
Free to start. Reports and prints on a paid seat.
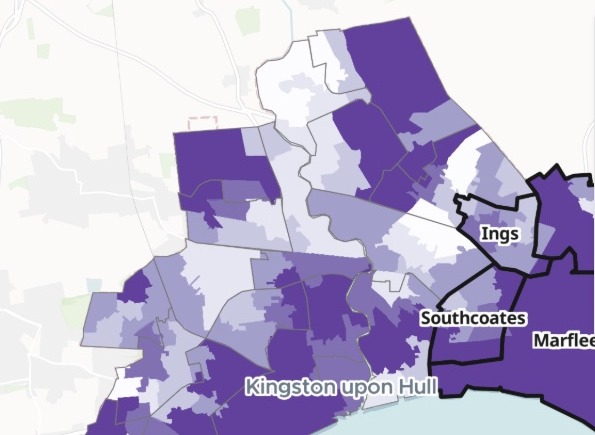
| Children in income-deprived families | |
|---|---|
| The four wards | 60.58% |
| Hull as a whole | 52.35% |
| The gap, in percentage points | 8.23 |
The four wards set against the city, from the government's own figures.
For whoever writes the bid
Charities.Community groups.Social enterprises.Town and parish councils.
Every funder asks for evidence of need, and the figures that show it are public.
Evidence of need is the part of a funding bid that shows the problem is real, local and worse than in the places around it. Funders expect official figures, properly cited.
Here you attach the government's figures and say where you work. Mapstack fetches the boundaries, turns published rates into the numbers a funder asks for, and writes the section.
One real bid
The case for four wards in east Hull
A small children's charity runs after-school and holiday clubs with a free hot meal in four wards, and is asking a national grant funder for three years. It attached the English Indices of Deprivation 2025 for Hull's 168 neighbourhoods (the small areas statisticians call LSOAs) and the lookup of which ward each is in.
- Most deprived tenth
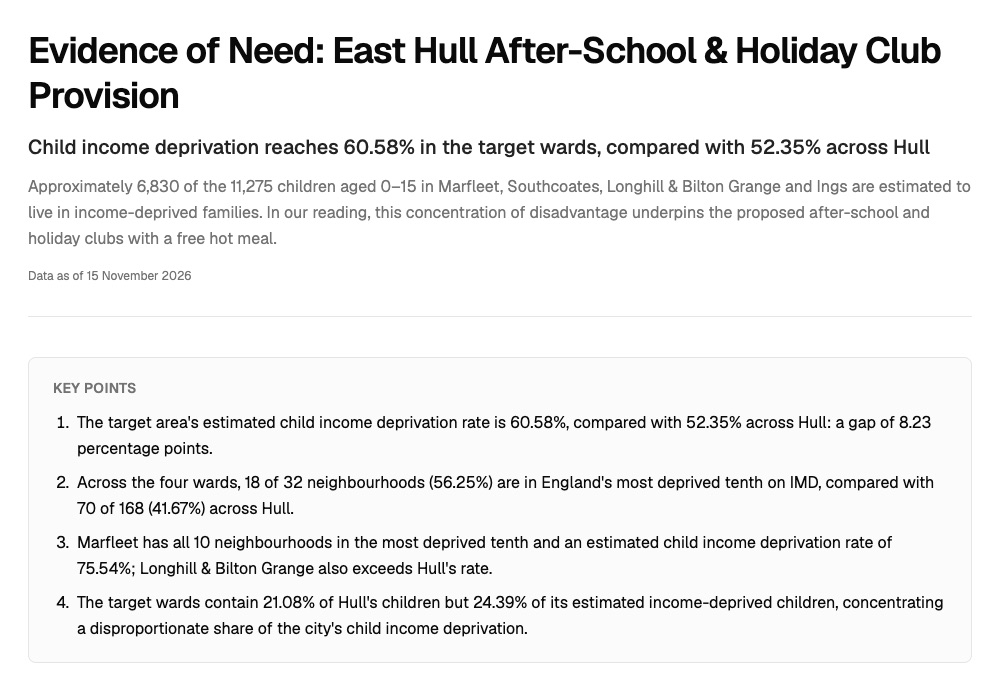
- 18 of 32neighbourhoods in the four wards are among England's most deprived 10% on the overall index, against 70 of 168 across Hull
- Share of the need
- 24.39%of Hull's income-deprived children live in the four wards, which hold 21.08% of its children
- Children in need
- 6,830of the 11,275 children aged 0 to 15 in the four wards are estimated to live in income-deprived families
| Ward | Children in income-deprived families | Most deprived 10% |
|---|---|---|
| Marfleet | 75.5% | 10 |
| Longhill and Bilton Grange | 62.7% | 6 |
| Southcoates | 52.2% | 2 |
| Ings | 37.6% | 0 |
It finds the need a list of the worst areas misses.
Ings has no neighbourhood in the most deprived tenth, yet about 707 of its children are estimated to live in income-deprived families. The report says so plainly, so a funder does not read the ward as a weak case.
Ministry of Housing, Communities and Local Government, English Indices of Deprivation 2025 (File 7), Kingston upon Hull. Office for National Statistics, LSOA (2021) to electoral ward (2024) lookup, and the 2021 LSOA and 2024 ward boundaries. Run on 15 November 2026.
Headline first, sources last, the way a funder reads
A title, the finding in one line, the key points, then a section for each part of the case.
- A table of the four wards, with the area together and the city beside them.
- Two maps: the whole city by deprivation with your wards outlined, and child income deprivation neighbourhood by neighbourhood.
- A sources and method note: what was used, how each estimate was made, and what the figures do not show.
- Reading kept apart from fact: interpretation opens with "In our reading" and never sits in the key points or the table.
How it goes
You bring the official files and say who the bid is for. Mapstack does the rest.
Attach the official figures and name your wards.
Mapstack fetches the boundaries and maps the need.
You get a report to send.
The report is where it starts
Ask about it, change it, and take it into the bid. Each of these is something you can ask for today.
Check a figure
It shows its working, the way a colleague would.
- Where does the estimate of children in income-deprived families come from?
Change it
Name the part and say what should change.
- Add a section on the ward with the most need, with a table of its neighbourhoods.
Put it in the bid
Download the report as Word for your own template, and add a map for the appendix.
- Make a print of the map of our four wards for the appendix.
Common questions
What happens to our files?
It stays in your workspace. Only people with a seat in your workspace can see it. Nothing leaves unless you publish it yourself.
It is not used to train AI. Your data and your conversations are not used to train AI models.
It is still yours. You keep ownership of what you bring in. Delete it and it is removed.
The full answer is in the documentation: Your data, privacy and security.
What does it cost?
Free to start. One seat, for you, with a starter amount of work each month. No card.
The maps and the figures are on the free seat. With your own files and public sharing.
The written report and prints are on a paid seat. Paid seats are per person, and bring more work each month.
The prices are on the pricing page.
How is the number of children worked out?
From the government's rate. Each neighbourhood’s share of children in income-deprived families (the IDACI measure), times its children aged 0 to 15, added up by ward.
Weighted by children. The rate for the wards together counts every child once, rather than averaging neighbourhoods.
Called an estimate. The report says it is an area measure, not a means test for families, so the bid claims no more than the figures show.
Write yours.
Free to start. Reports and prints on a paid seat.