
Bus punctuality, area by area
See where services run on time.
Attach the share on time by area, a column a year. You get each area shaded, every year a step away, and the best and worst ranked.
Free to start. No card.
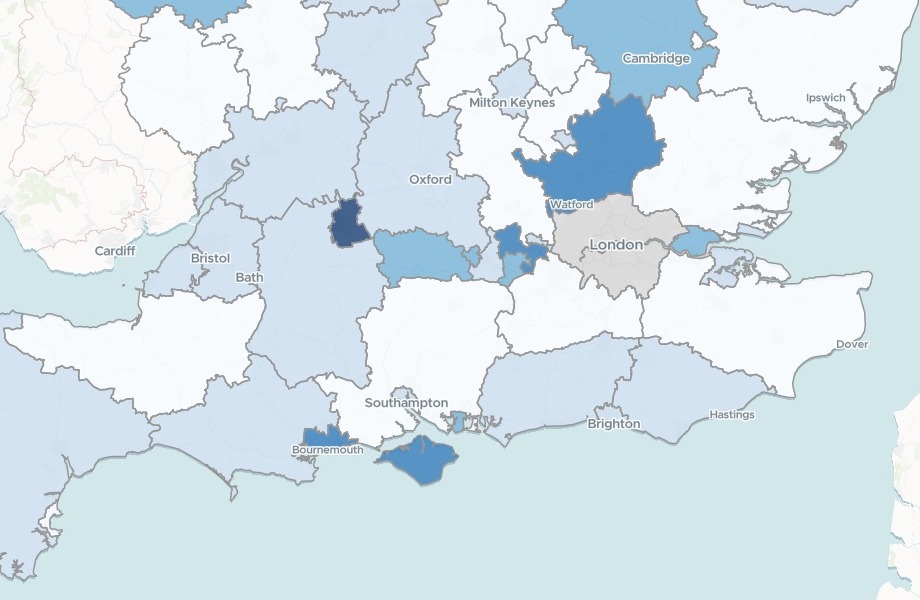
| On time in 2024/25 | Share |
|---|---|
| Highest | 92% and above |
| Higher | 87% to 92% |
| Middle | 82% to 87% |
| Lower | 76% to 82% |
| Lowest | Below 76% |
Swindon, the darkest, is the highest in England, at 98%.
For anyone who answers for running on time
Buses by council.Trains by region.Deliveries by depot.
Where the share on time held up, and where it slipped, is the question.
Punctuality, or on-time performance, is a share: the services that ran within a window of the timetable. In the Department for Transport's bus figures, on time means from one minute early to five minutes 59 seconds late.
A briefing on it needs a map of where, year by year, and the ranked lists behind it. Here you attach the table, and Mapstack makes both.
From a published table to a map of the areas
Columns: LA Code (each area’s official code), LA or Region (its name), 2005 (the share on time that year), 2025 (the latest year, with a column for each year between). 98 rows. One row for each area, a column for each year, [z] where there is no figure, and no shapes.
What you get
- The official boundaries, found for you.
- The areas shaded by the share on time, year by year.
- The rankings: the lowest and highest, and the biggest falls and rises since 2019.
- Each area’s card: its 2019 and 2025 figures, the change and a trend line.
One real table
Since 2019, the falls ran deeper than the rises
The Department for Transport's published table of bus punctuality for every local transport authority in England, a column a year from 2005 to 2025. 64 authorities have a figure for both 2019 and 2025.
- Fell furthest
- −18points each, in Derby, Warwickshire and Buckinghamshire
- Next furthest
- −17points in Essex, from 92% to 75%
- Rose furthest
- +12points in Merseyside, from 80% to 92%
| Biggest changes since 2019 | Points |
|---|---|
| Derby | −18 |
| Warwickshire | −18 |
| Buckinghamshire | −18 |
| Essex | −17 |
| Merseyside | +12 |
| Swindon | +11 |
It ranks only like with like.
A change needs a figure in both years, so Mapstack counted those first and ranked the changes among them, in percentage points, each with its 2019 and 2025 figures. The other 34 rows had a gap in one year, or a reorganisation.
Department for Transport, bus statistics table BUS09a: non-frequent bus services running on time by local authority, England, years ending March 2005 to 2025 (Official Statistics, Open Government Licence v3.0). Boundaries fetched by Mapstack. Run on 15 November 2026.
How it goes
You bring the years. Mapstack finds the areas and does the ranking.
Attach your on-time table and say what to rank.
Mapstack shades the areas, opening on the latest year.
You get the rankings. Here, the next lowest in 2025 after North Northamptonshire, at 61%.
Common questions
What happens to our figures?
It stays in your workspace. Only people with a seat in your workspace can see it. Nothing leaves unless you publish it yourself.
It is not used to train AI. Your data and your conversations are not used to train AI models.
It is still yours. You keep ownership of what you bring in. Delete it and it is removed.
The full answer is in the documentation: Your data, privacy and security.
What does it cost?
Free to start. One seat, for you, with a starter amount of work each month. No card.
This job is on the free seat. Maps, datasets, analysis, your own files and public sharing are all included.
Pay per person for more. A paid seat brings more work each month, and seats for your team.
The prices are on the pricing page.
How are the years handled?
A time slider. It runs from 2015 to 2025 and opens on the latest year.
Gaps stay gaps. A year with no figure shows as no data, never as zero.
See where yours run on time.
Free to start. No card.