
Story map
Turn a table of figures into a story map.
Attach the figures. You get one report: a headline that states the finding, key points, and short passages, each with its own map or chart.
Reports are on a paid seat.
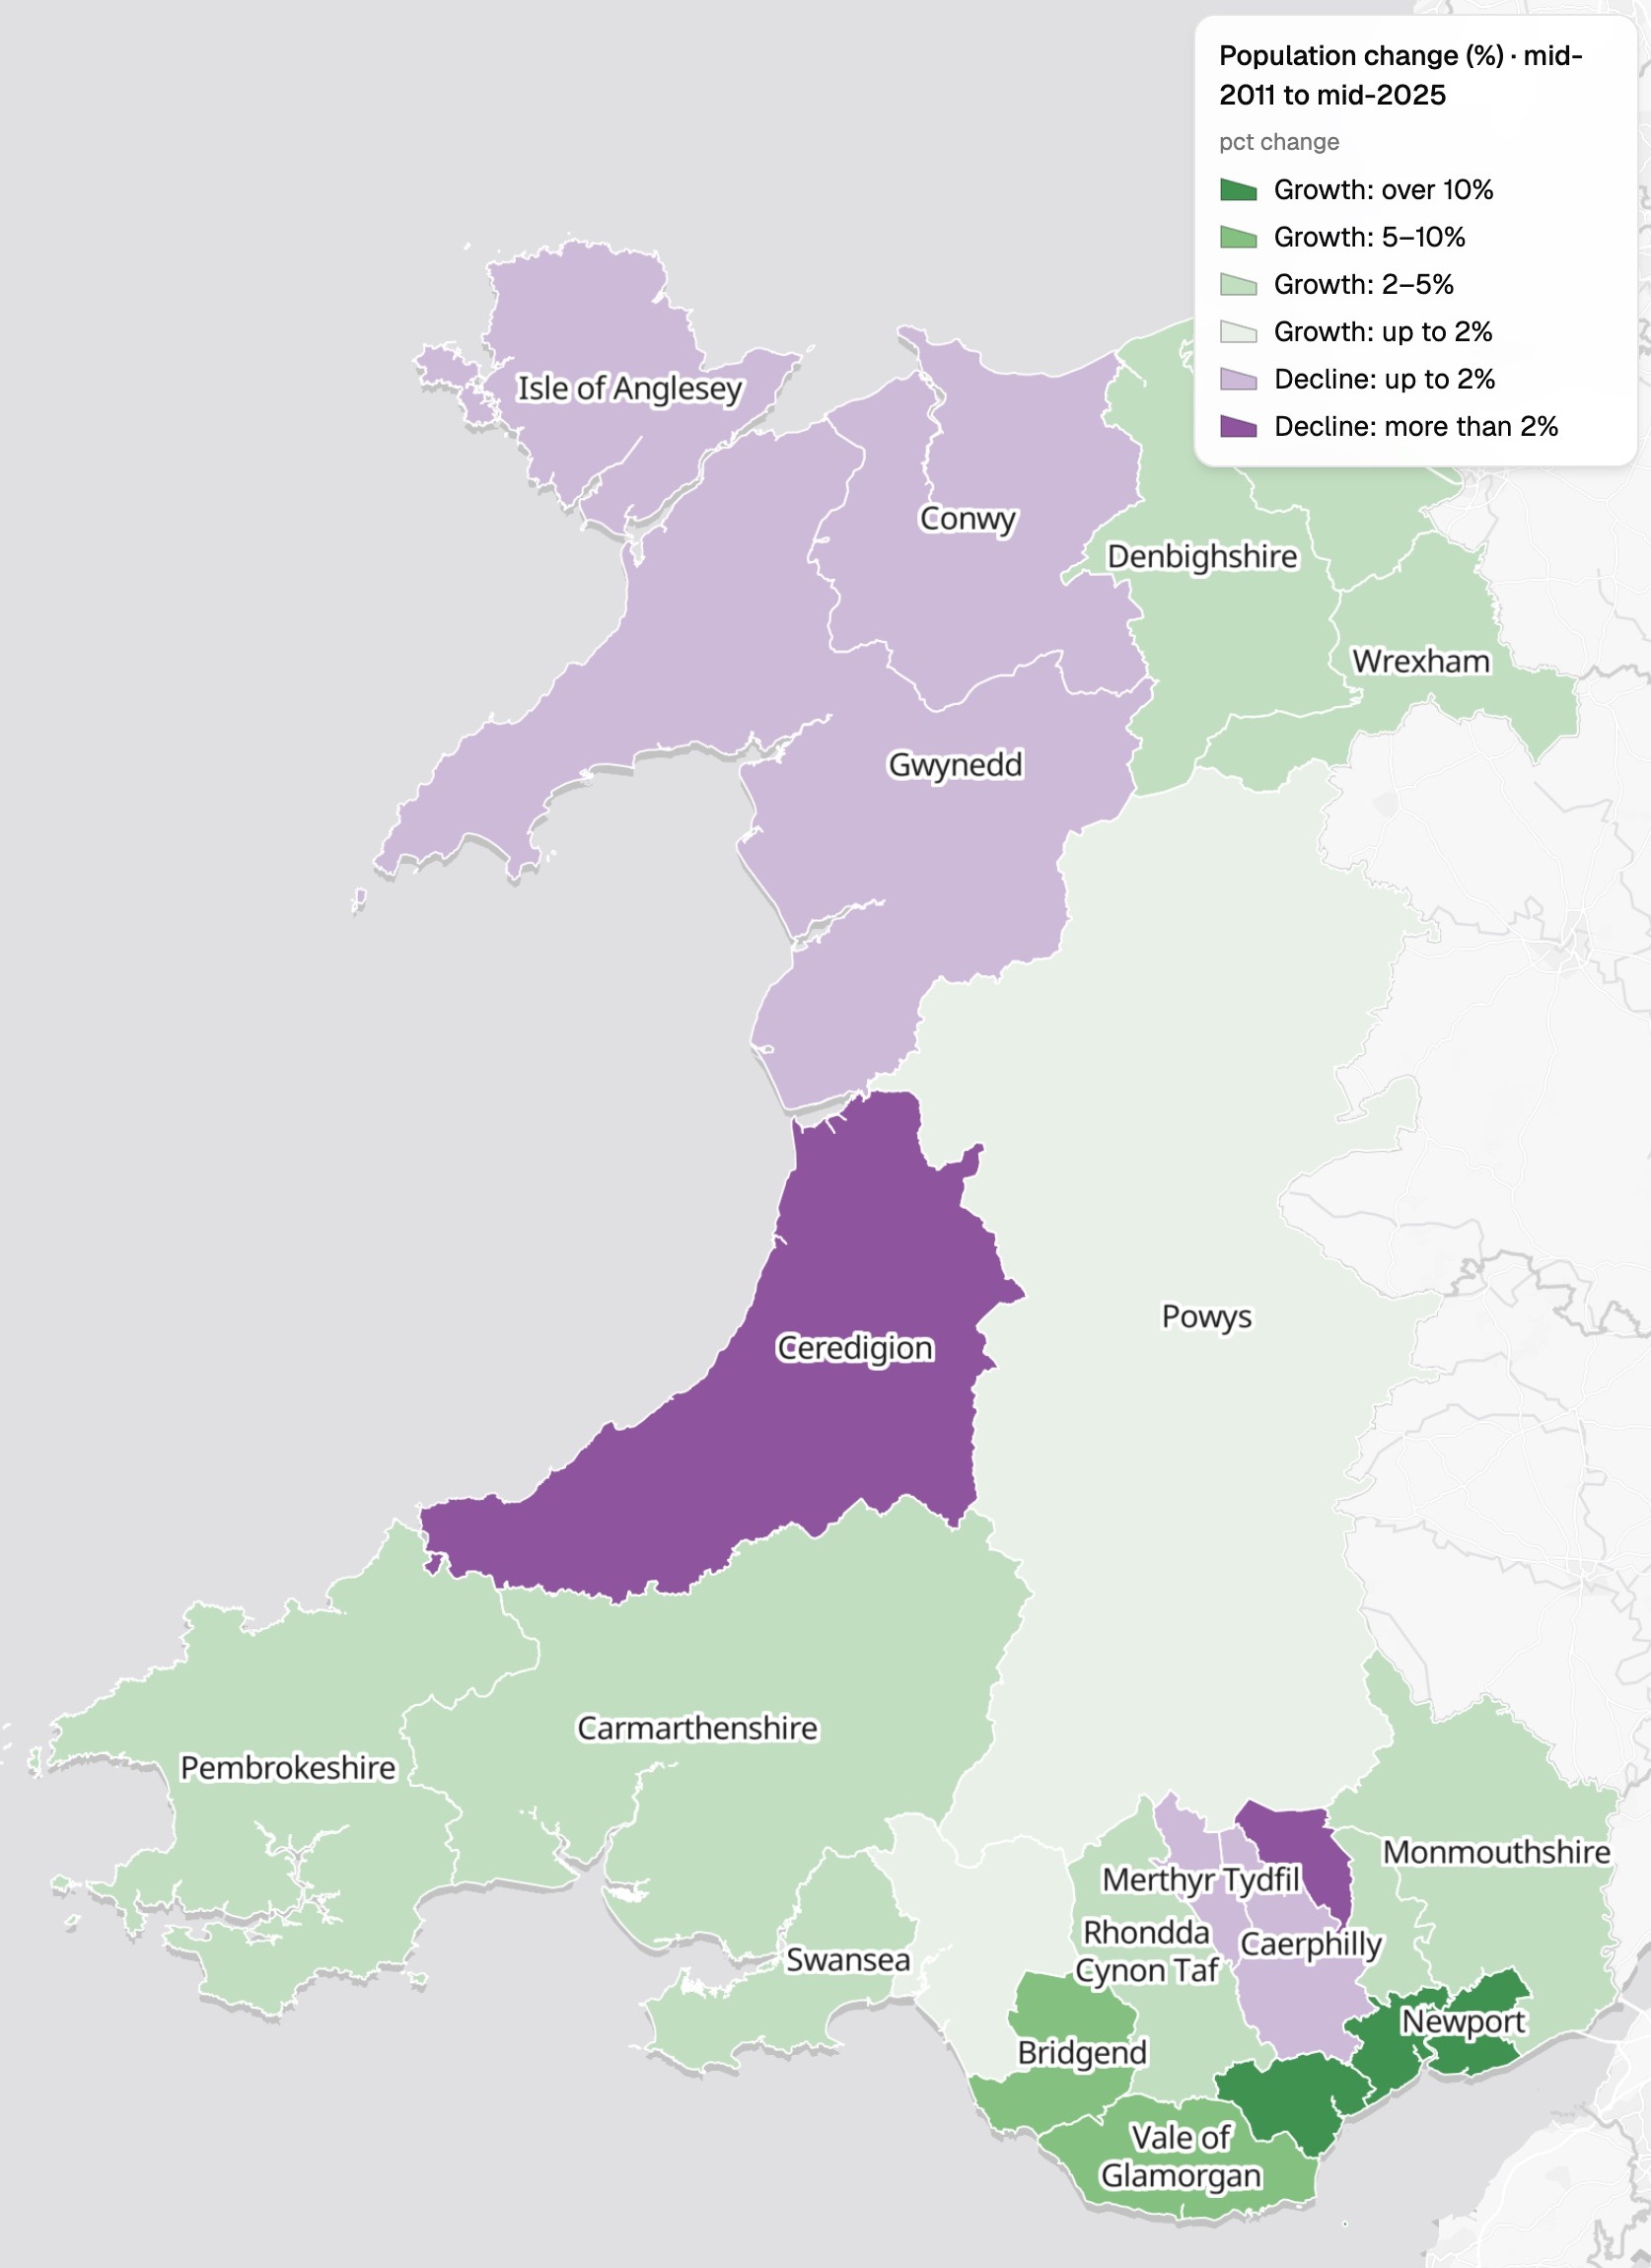
| Change by council, Wales | Councils |
|---|---|
| Grew by over 10% | Cardiff, Newport |
| Grew by 5 to 10% | Vale of Glamorgan, Bridgend |
| Grew by 2 to 5% | Swansea, Carmarthenshire and 7 more |
| Grew by up to 2% | Powys, Neath Port Talbot |
| Shrank by up to 2% | Gwynedd, Caerphilly and 3 more |
| Shrank by over 2% | Ceredigion, Blaenau Gwent |
Growth in greens, decline in purples, and the councils named on the map.
For whoever has to explain the numbers
Data desks.Research teams.Charities making a case.The figures come as a table.
Readers need to be walked through them.
A story told in short passages, each with its own map or chart, is what mapping people call a story map.
Here you attach the figures and say what the story should cover. Mapstack finds the boundaries your table refers to, works out the figures and writes it in plain words.
It opens with the finding
A headline that says what happened, the key points, then the story in order.
- A headline that states the finding, not just the subject.
- Key points: the facts a reader should leave with.
- Guided sections: the whole, then the councils, the biggest movers and the regions, each with its own map or chart.
- About the data: how each figure was worked out, and what the data cannot explain.
One real story
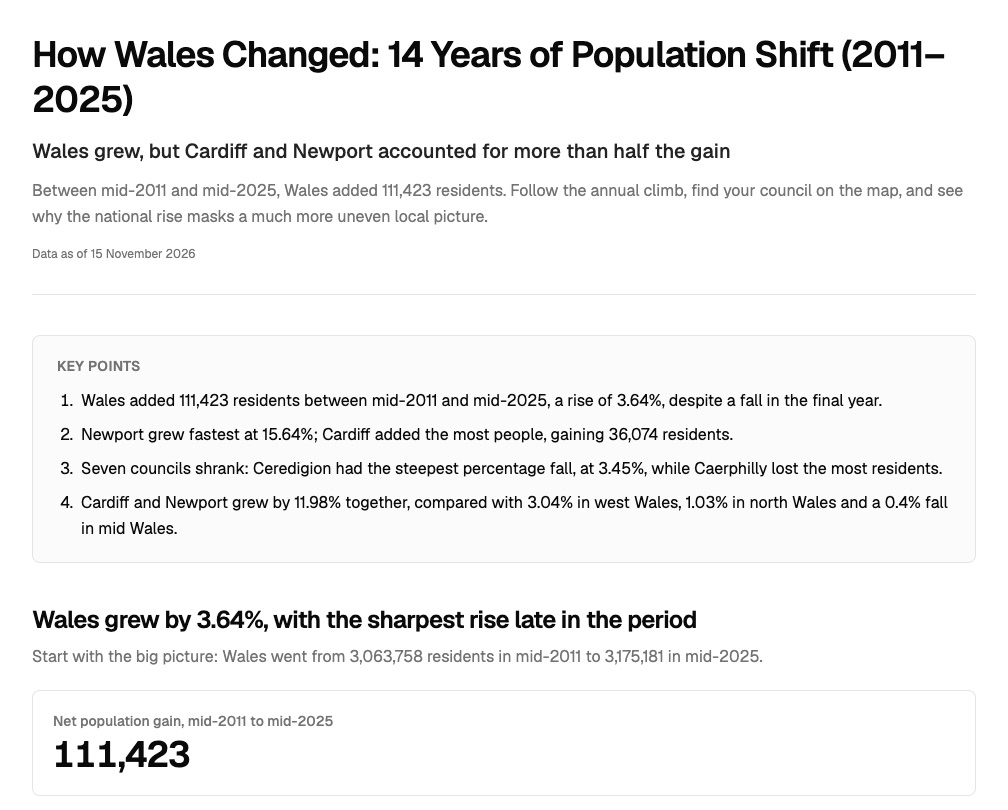
Two cities took more than half the gain. Seven councils shrank.
The Office for National Statistics' population estimates for Wales's 22 councils, mid-2011 to mid-2025, attached as a table. Mapstack fetched the council boundaries itself and wrote the story from one request.
- Fastest growth
- Newportup 15.64%, the only council to grow every year
- Most people added
- Cardiff36,074 more residents
- Share of the gain
- 52.84%of Wales's net gain, in Cardiff and Newport together
| Councils that shrank | Residents lost | Fall |
|---|---|---|
| Caerphilly | 2,704 | 1.51% |
| Ceredigion | 2,597 | 3.45% |
| Blaenau Gwent | 2,219 | 3.18% |
| Isle of Anglesey | 1,306 | 1.87% |
| Gwynedd | 1,228 | 1.01% |
| Conwy | 905 | 0.78% |
| Merthyr Tydfil | 489 | 0.83% |
It tells two kinds of loss apart.
Caerphilly lost the most people; Ceredigion fell furthest for its size. The story says why both matter: a council's size changes how the same loss looks as a percentage.
Office for National Statistics, population estimates for the UK, England, Wales, Scotland and Northern Ireland, mid-2025 release: Wales’s 22 councils, mid-2011 to mid-2025. Council boundaries found by Mapstack. Run on 15 November 2026.
How it goes
You bring the figures. Mapstack writes the story.
Attach the table and say what the story should cover.
Mapstack finds the boundaries and maps the change.
You get a story to link to.
Common questions
How do readers get it?
A public link. Publish it and anyone with the link can open it, with no sign-in.
Word or PDF. Download it for your own site or publishing system.
Does it say what the figures cannot?
Its groups, named. Ask loosely for regions and the story says which areas each one holds.
Its limits, stated. Here, estimates with no births, deaths or migration, so the story describes the change and does not claim its causes.
What does it cost?
Reports are on a paid seat. Paid seats are per person, and bring more work each month.
Free to look around. Maps, datasets and analysis are on the free seat. No card.
The prices are on the pricing page.
What happens to our figures before we publish?
It stays in your workspace. Only people with a seat in your workspace can see it. Nothing leaves unless you publish it yourself.
It is not used to train AI. Your data and your conversations are not used to train AI models.
It is still yours. You keep ownership of what you bring in. Delete it and it is removed.
The full answer is in the documentation: Your data, privacy and security.
Tell yours.
Reports are on a paid seat.