
Parking occupancy
See how full the parking is on every block.
Attach the occupancy readings and state your target. You get every block face mapped by rate period, and a call on each area’s rate: up, down or stay.
Free to start. Printed briefing sheets on a paid seat.
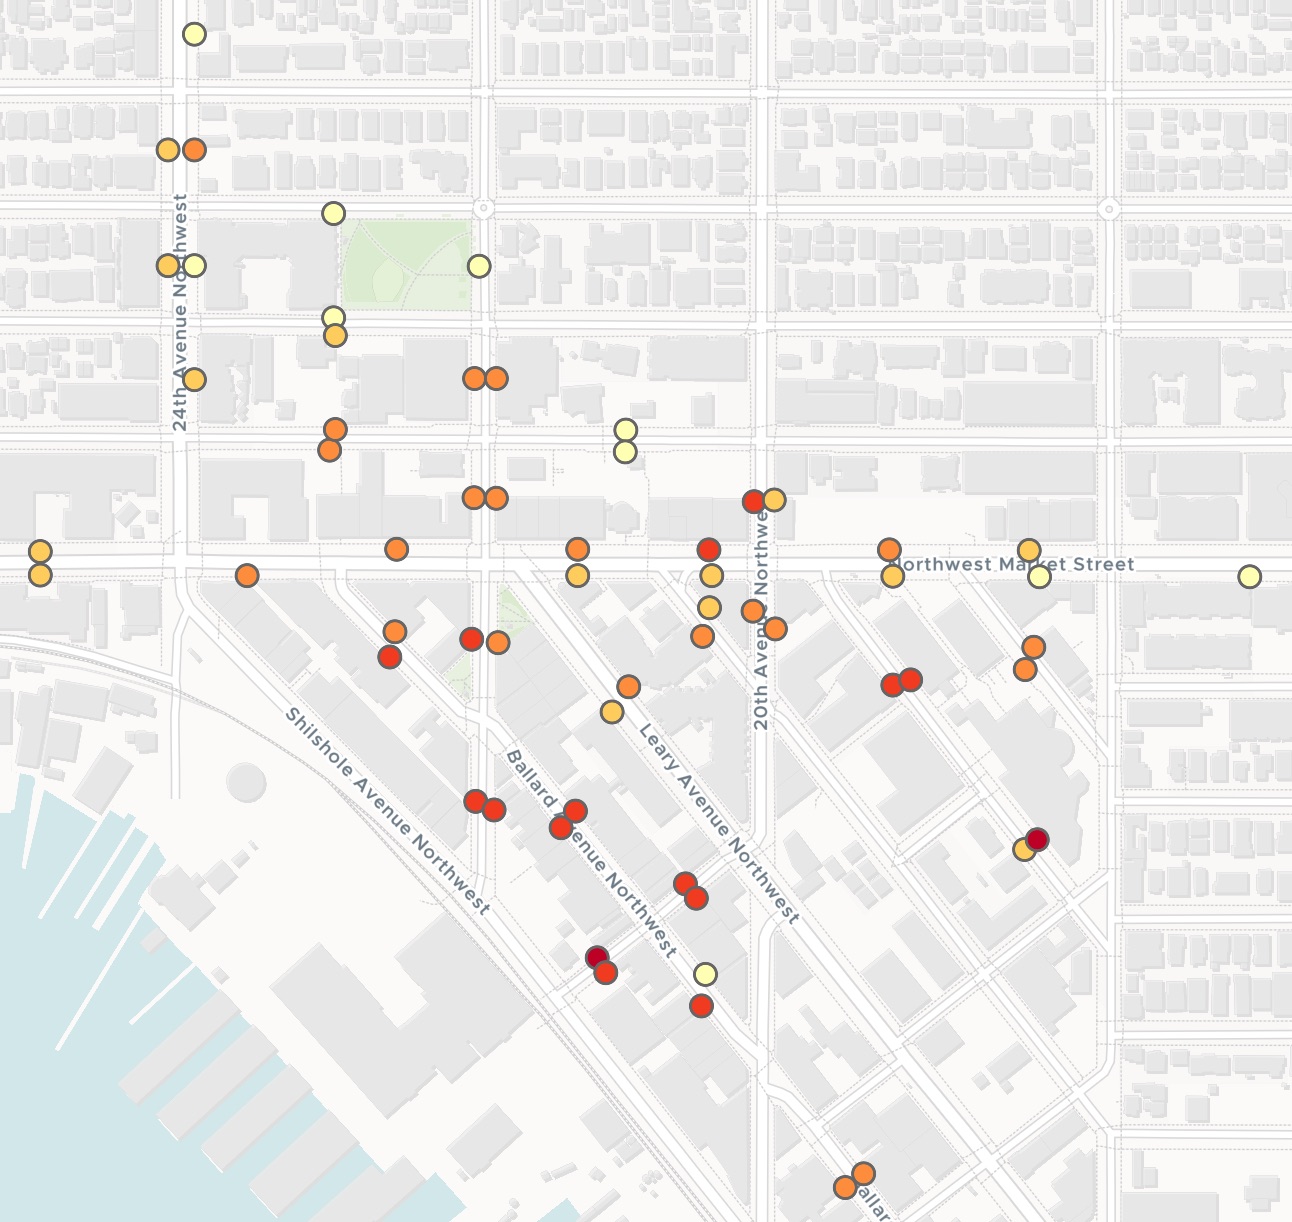
| Midday, how full | Block faces |
|---|---|
| 81.4% and above | 2 |
| 52.7% to 81.4% | 14 |
| 38.2% to 52.7% | 21 |
| 23.9% to 38.2% | 14 |
| Below 23.9% | 10 |
The map switches between the morning, midday and evening periods.
For whoever sets the price of the curb
The meters record every session.
The rate review needs one answer for each area and each period: up, down or stay.
Cities that price parking by demand, often called performance-based pricing, set a target for how full the curb should be and move the rate towards it.
Here you attach the published readings and state your target. Mapstack does the averaging, applies your rule and maps the blocks.
From hourly readings to one figure a period
Columns: Hour (when it was read), Block face (the street, its ends and side), Paid sessions (paid at that moment), Spaces (on the block face), Subarea (Core or Edge). 15,948 rows. One row per block face per hour, every weekday of a month, with its coordinates.
What you get
- Each block face averaged in each of your rate periods.
- Each subarea as a whole, period by period, with an up, down or stay call.
- The fullest and the emptiest block faces, ranked by name and side.
- A map with a period switch. Select a block face for its figures in all three.
One real month
Below the target in every period
Seattle's published paid parking occupancy for Ballard, every weekday of October 2025, set against the 70% to 85% target in the request.
- The call
- Downin every period, in both the Core and the Edge
- Fullest
- 81.89%across the day: NW Vernon Pl, between Ballard Ave NW and Shilshole Ave NW
- Emptiest
- 9.13%across the day: a one-space block face on Ballard Ave NW
| Subarea and period | How full |
|---|---|
| Core, 8 to 11am | 19.76% |
| Core, 11am to 5pm | 49.30% |
| Core, 5 to 8pm | 58.06% |
| Edge, 8 to 11am | 23.88% |
| Edge, 11am to 5pm | 37.26% |
| Edge, 5 to 8pm | 39.50% |
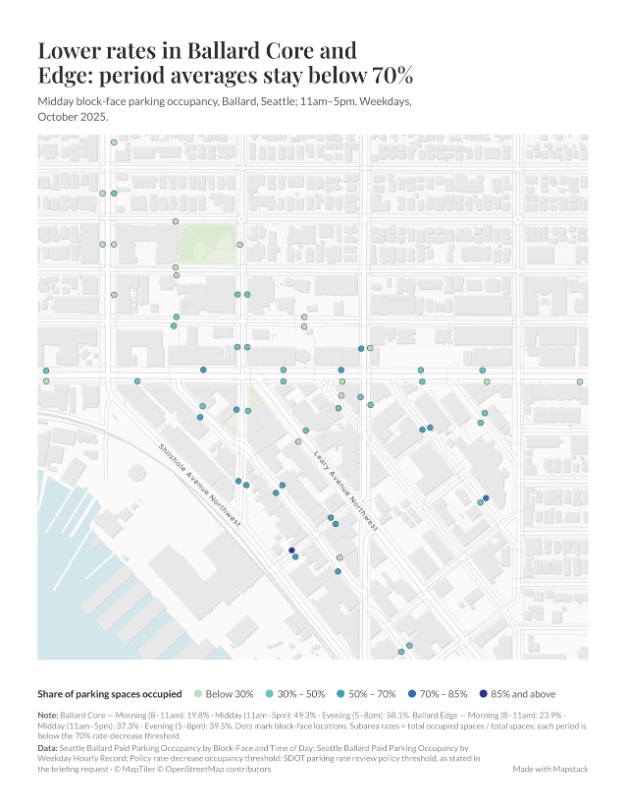
Even the Core in the evening sits below 70%.
So by your policy the call is down, everywhere. Mapstack still ranked the block faces that run hot, so a busy street is not lost in the average, and said where the empty ones sit: the outer Edge, along NW Market St, 24th Ave NW and NW 56th to 58th St.
City of Seattle, Seattle Department of Transportation, 2025 Paid Parking Occupancy (data.seattle.gov): Ballard, weekdays of October 2025, readings on the hour from 8am to 7pm. Run on 15 November 2026.
One sheet for the rate review
Ask for a briefing sheet and the result is printed for the meeting.
- Headlined with the call, in the words of the finding.
- The midday map, its shades split at your policy’s lines.
- Every period’s figures for the Core and the Edge, in a note under the map.
- US Letter, downloaded as a PDF or a PNG.
How it goes
You bring the readings and the rule. Mapstack does the sums.
Attach the readings and state your policy.
Mapstack averages them and maps the blocks.
You get the call, period by period.
Common questions
What does the file need?
One row per reading. The time, the block face and its paid sessions.
The spaces on each block face. So a count of sessions becomes a share of the curb.
Where each one is. Coordinates, as a city’s open data gives them.
What does it cost?
Free to start. One seat, for you, with a starter amount of work each month. No card.
The averages, the rate call and the map are on the free seat. With your own files and public sharing.
Printed briefing sheets are on a paid seat. Paid seats are per person, and bring more work each month.
The prices are on the pricing page.
What happens to our parking data?
It stays in your workspace. Only people with a seat in your workspace can see it. Nothing leaves unless you publish it yourself.
It is not used to train AI. Your data and your conversations are not used to train AI models.
It is still yours. You keep ownership of what you bring in. Delete it and it is removed.
The full answer is in the documentation: Your data, privacy and security.
Check your curb.
Free to start. Printed briefing sheets on a paid seat.