
Composite index: one score per area
Combine several measures into one score per area.
Name the measures and how much each should count. You get a weighted score for every area, ranked and mapped in five equal groups (quintiles), with the method written down.
Free to start. No card.
| Census tracts | Tracts |
|---|---|
| Scored | 180 |
| In the highest-scoring fifth | 36 |
| Could not be scored | 4 |
The highest score, 0.527, is in a tract where 62% of people are below the poverty line.
For whoever decides where a programme goes first
Cooling centres.Outreach.Grants.Inspections.
There is never enough for everywhere, so someone has to rank the areas, and defend the ranking.
The usual way is four spreadsheets, a formula nobody else can follow, and a map made last.
This builds the score from published figures, shows every measure behind it, and tests how much your choices matter.
One real score
184 tracts, four measures, one ranking
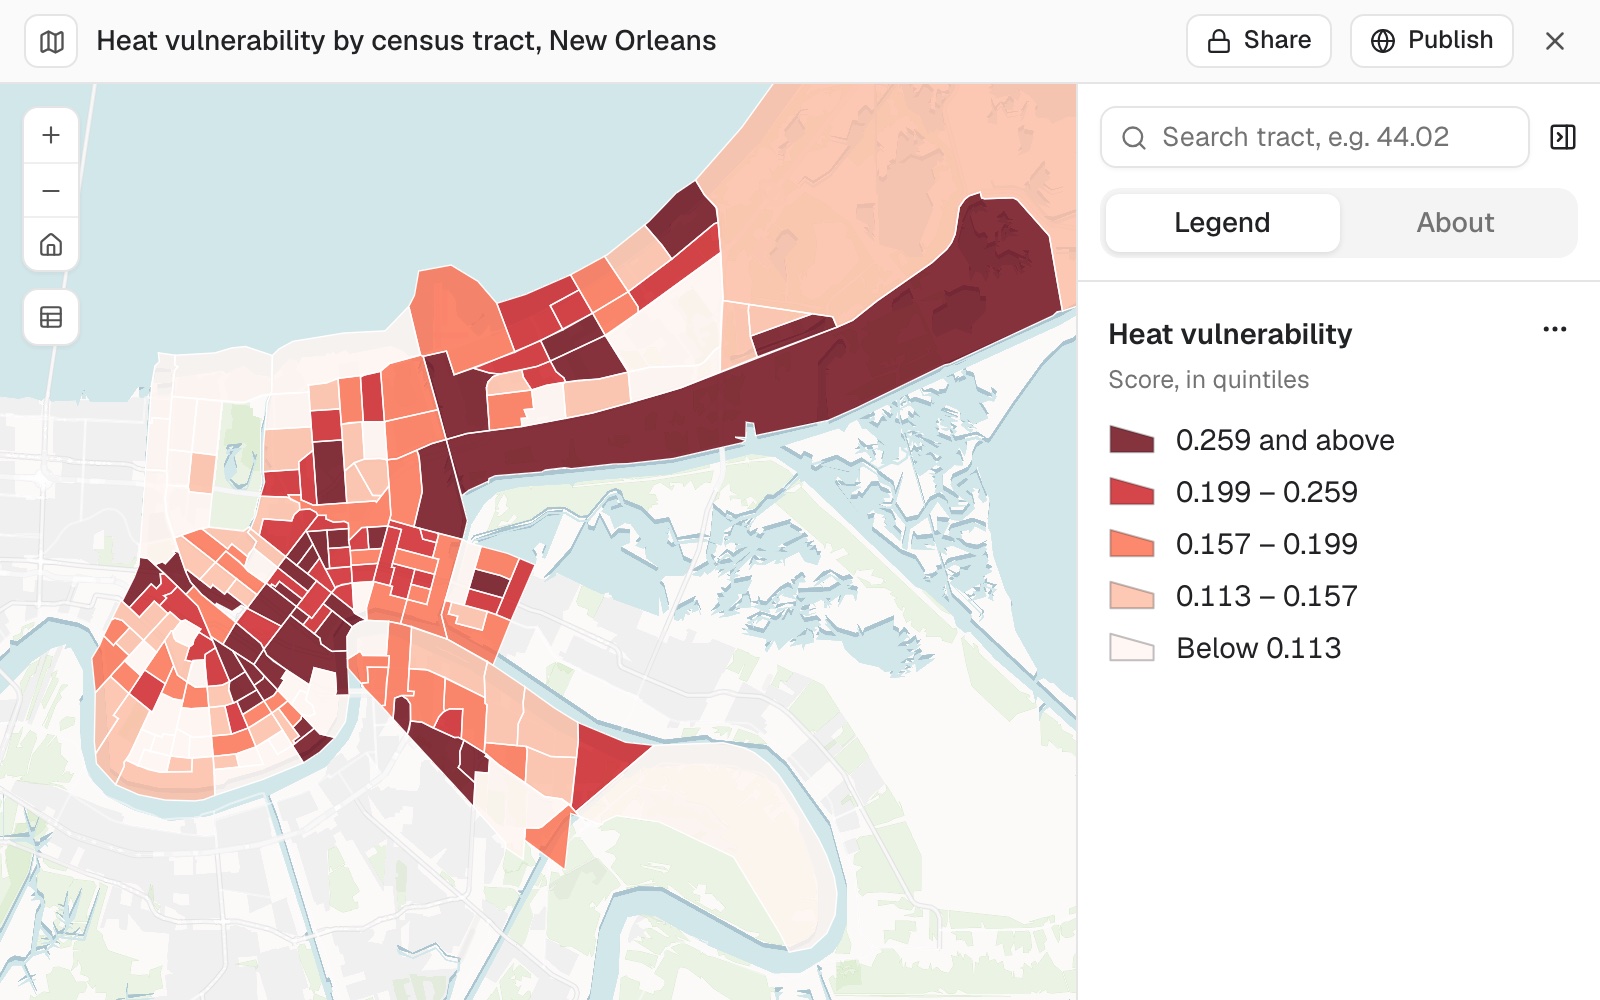
A heat vulnerability score for every census tract in New Orleans, to target cooling centres. Poverty and no vehicle count double.
- The areas
- 184census tracts, 180 of them scored
- The top group
- 36tracts in the highest-scoring fifth
- The highest score
- 0.527in tract 6.20
| In the highest-scoring tract | Share |
|---|---|
| Households with no vehicle | 64% |
| People below the poverty line | 62% |
| People with a disability | 35% |
| People aged 65 or over | 29% |
The score is twice poverty, plus twice no vehicle, plus age, plus disability, divided by six. It says which areas it could not score, and why.
Here that was 4 of the 184: three tracts with almost no one living there, and one where all 1,822 residents live in an institution, which the survey leaves out of its poverty, household and disability counts.
US Census Bureau, American Community Survey 2020 to 2024 5-year estimates, tables B17020, B25044, B01001 and C18130. Run on 11 November 2026.
Test how much your choices matter
Weights and scaling are judgement calls. A ranking you will defend should survive a change to them.
Rescaling first stops a measure with a wide spread, like poverty here, counting for more than its weight says.
How much does the top 20 change if all four weights are equal? And separately, if each measure is first rescaled to run from 0 to 1 across the tracts?
With equal weights, 16 of the top 20 stayed. With each measure rescaled first, 18 stayed. Mapstack named each tract that came in or dropped out, and why.
How it goes
You choose the measures and the weights. Mapstack does the fetching, the arithmetic and the mapping.
Name the measures and the weights.
Mapstack fetches each measure and builds the score.
You get the score, the measures behind it, and the method.
The step-by-step guide is in the documentation: Combine several measures into one score per area, to target a programme.
Common questions
What does it cost?
Free to start. One seat, for you, with a starter amount of work each month. No card.
This job is on the free seat. Maps, datasets, analysis, your own files and public sharing are all included.
Pay per person for more. A paid seat brings more work each month, and seats for your team.
The prices are on the pricing page.
Can I see the method?
Ask for it in writing. Each measure's census table and columns, the formula and weights, how the classes were cut.
Every measure kept. The table has each share beside the score and the rank.
Keep it with the map. So whoever acts on the ranking can see how it was made.
Build yours.
Free to start. No card.