
Mapstack Reports and print maps
AI reports and print maps for GIS work.
Ask for the report or the print. Mapstack writes it and lays it out to scale.
Free to start. Reports and prints on a paid seat.
Watch a report get written
One request, start to finish: asked for in plain words, written from the data, handed back for your review.
The last mile of every project, done.
Your AI teammate does the write-up
From a result on your screen to a page someone else can read, handed back for your review.
Ask for the deliverable
Say who will read it and what it has to cover. Mapstack writes and lays it out, so you skip the hours in a layout window.
The finding first, the method last
A report opens with what the data shows and closes with how it was worked out, so a busy reader gets the point and a careful one can check it.
Every figure traced to its source
Numbers come from the data, never from thin air, and each one can be followed back. You can stand behind every line.
Print-ready, to scale
Map sheets come at true size with a scale bar that measures true. What you send to the plotter is what comes out.
Sized for where it is going
Paper, a slide, a figure for a paper, a post for social. One result, laid out properly for each, so you never stretch a screenshot again.
Revise by asking
A new title, another class, a different page size. Say what should change and the rest is kept.
One result, every format it has to travel in
The same analysis usually has to reach a committee, a plotter, a slide deck and a feed. Each gets its own layout, not a crop of another.
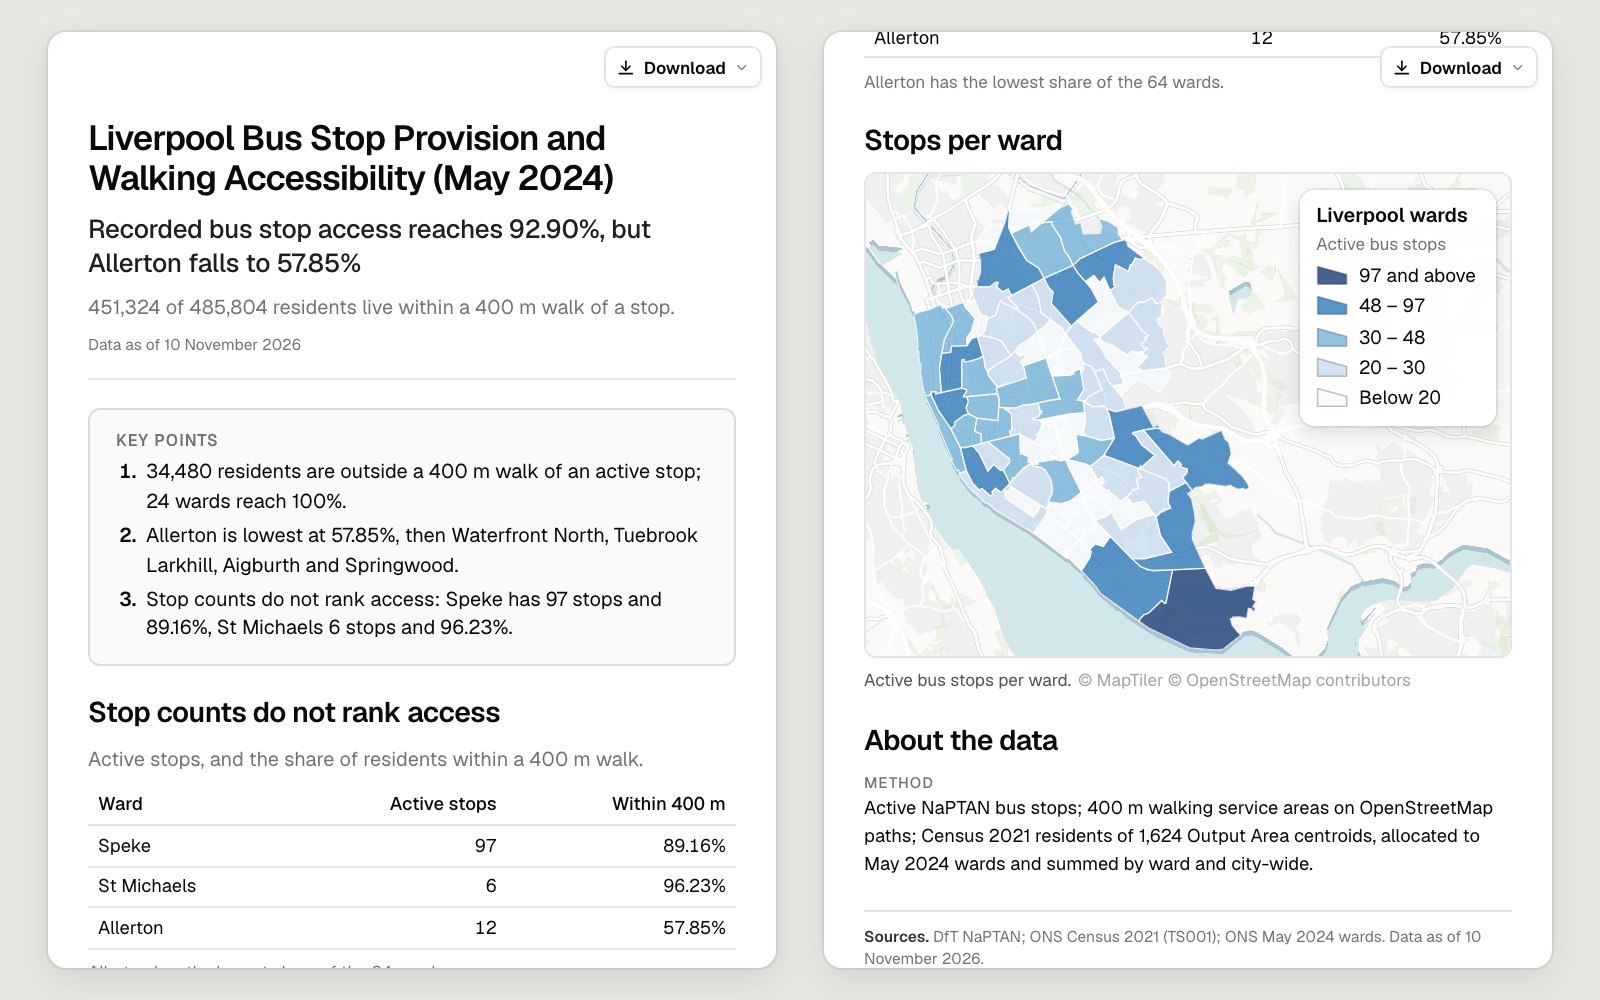
A report
Key points, tables, charts and maps, with the method at the end.
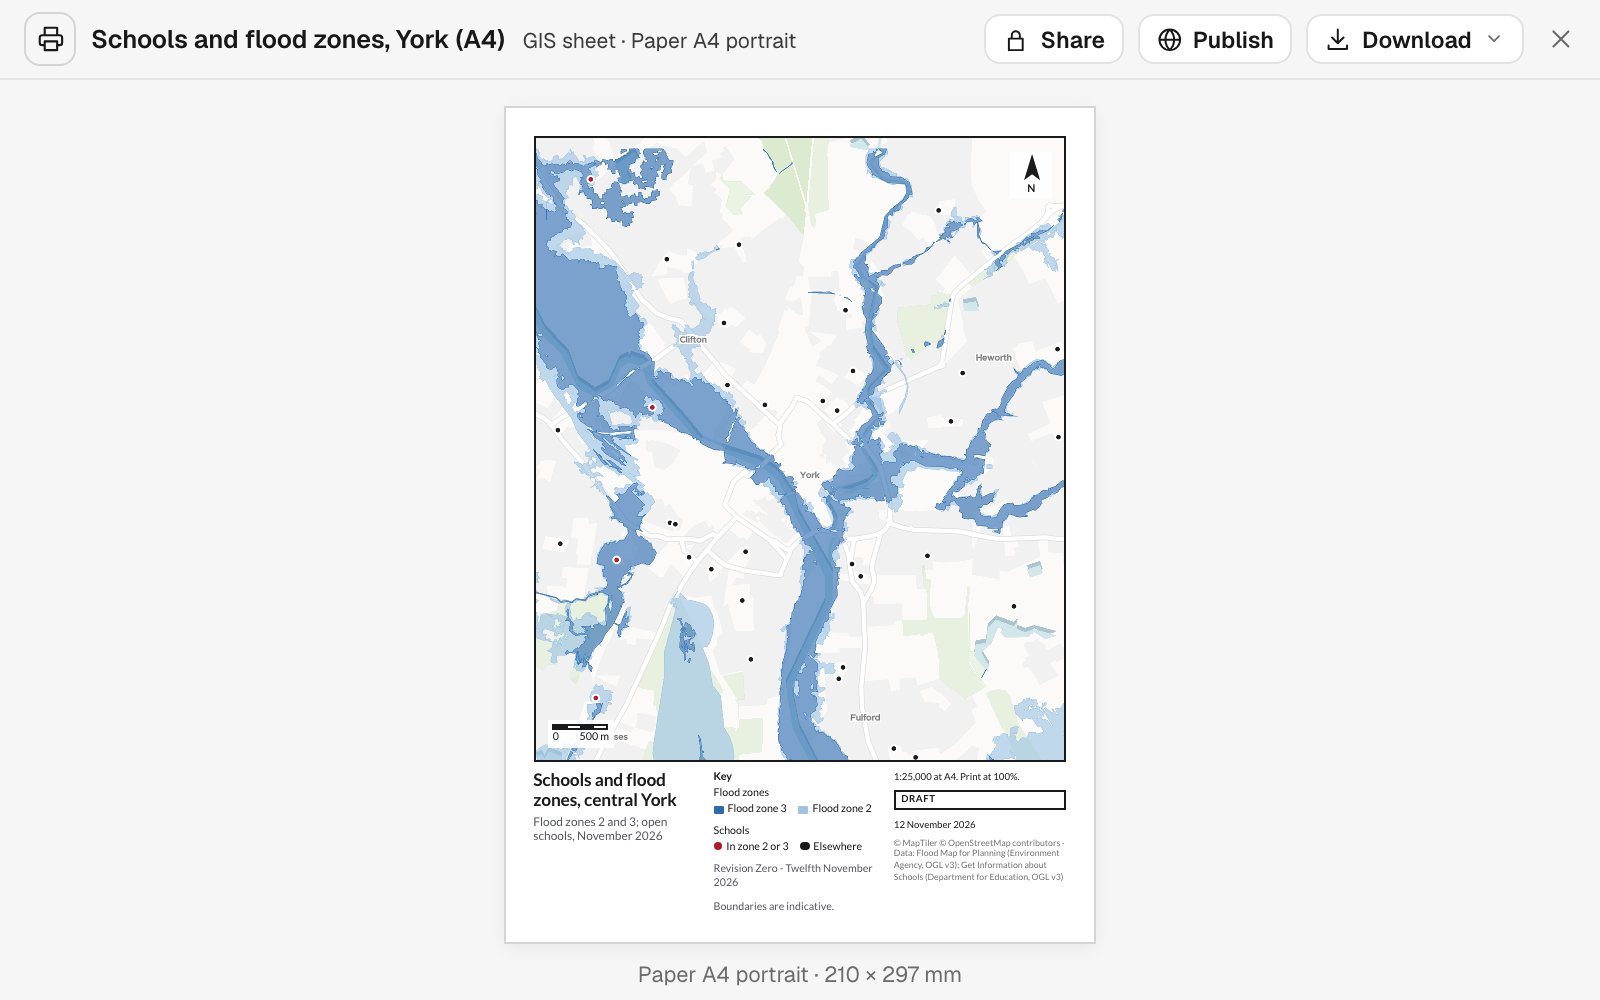
A map sheet
To scale, with a title panel, key, scale bar and north arrow.
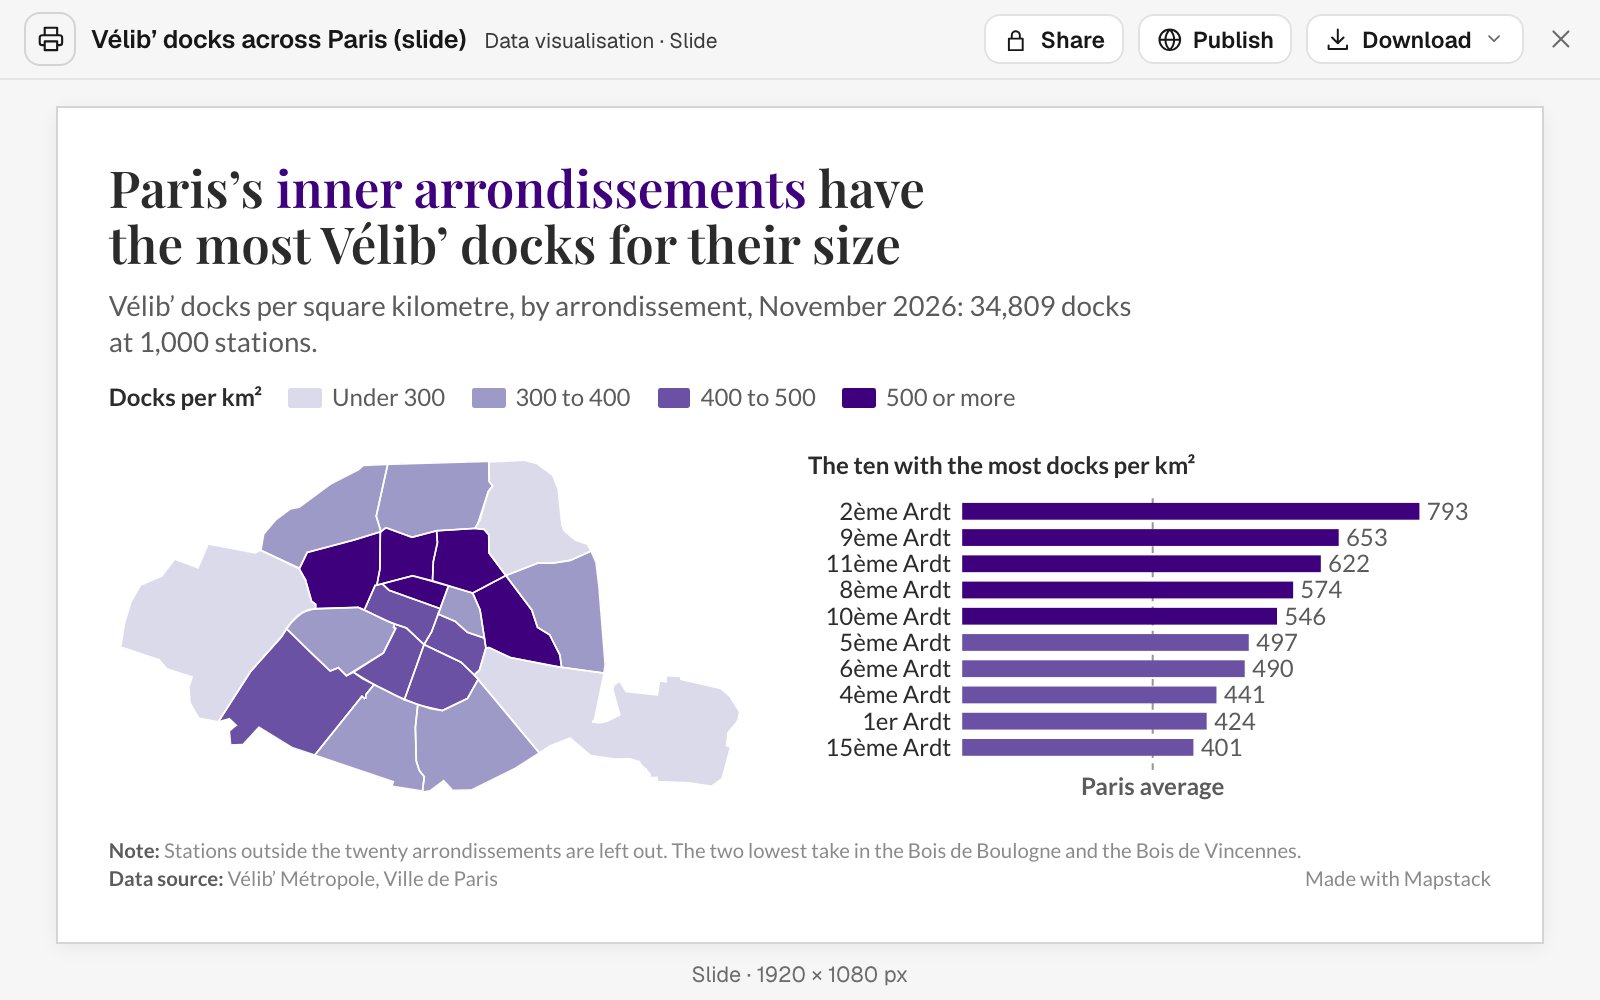
A slide
The finding as the title, with the map and one chart.
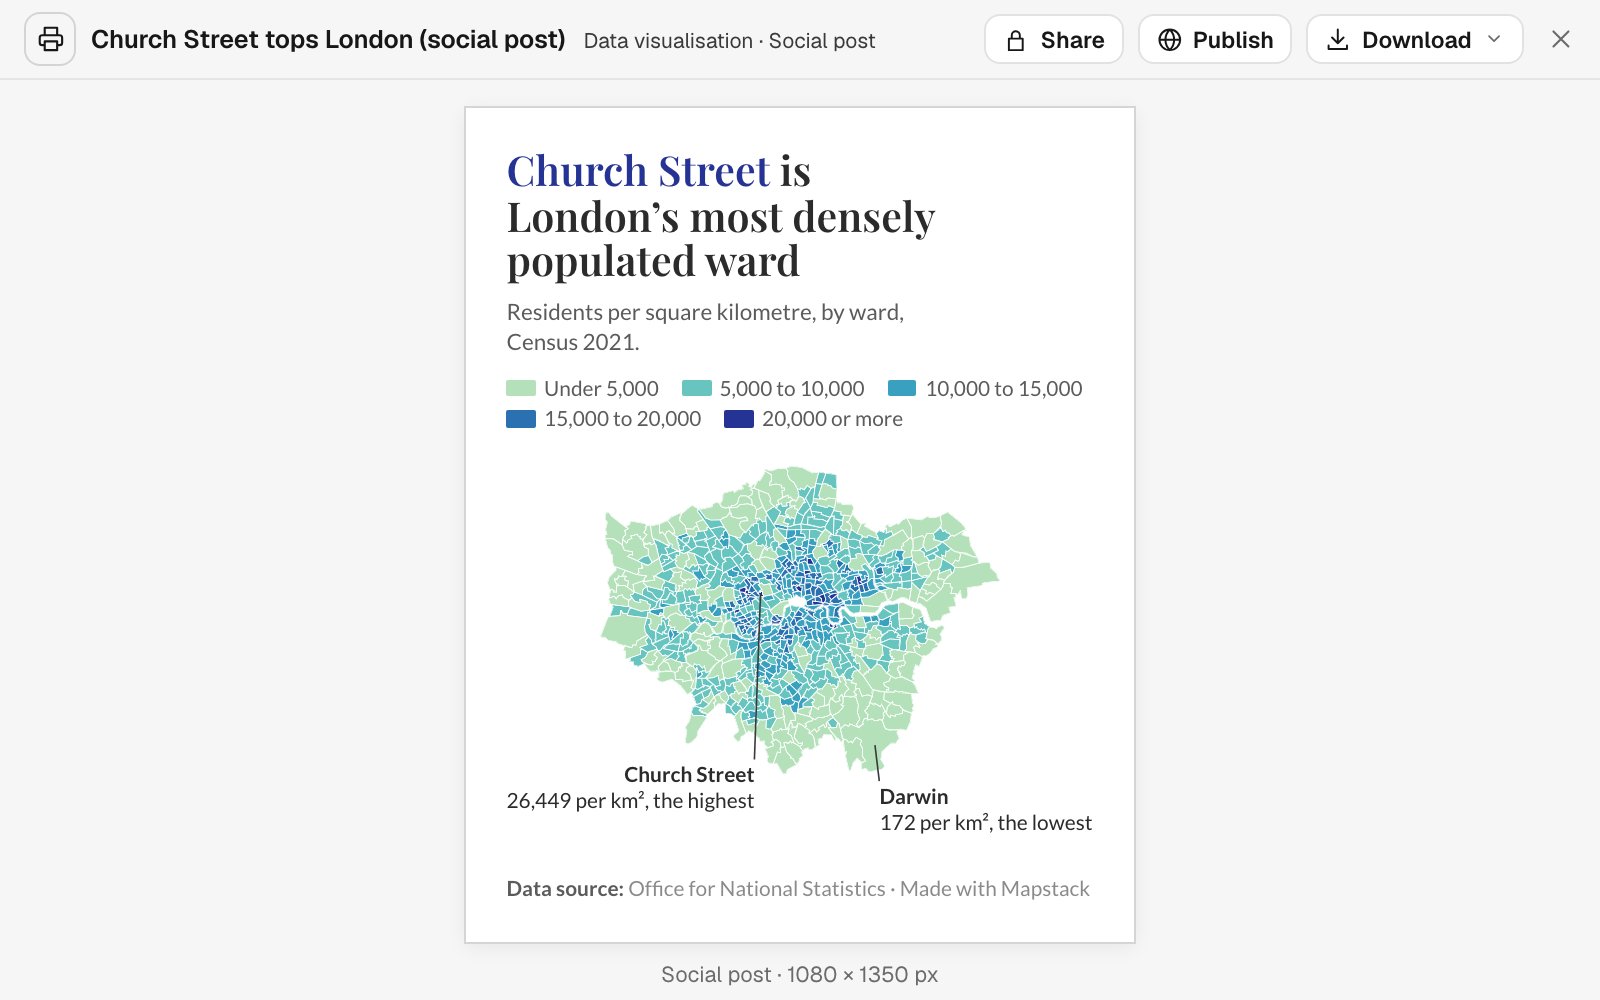
A post or a figure
Square, tall or a set width, for a feed or a journal.
Every sheet carries what a map sheet should
The furniture a reviewer looks for is there without being asked for, and it is correct, because it is drawn from the map and not typed beside it.
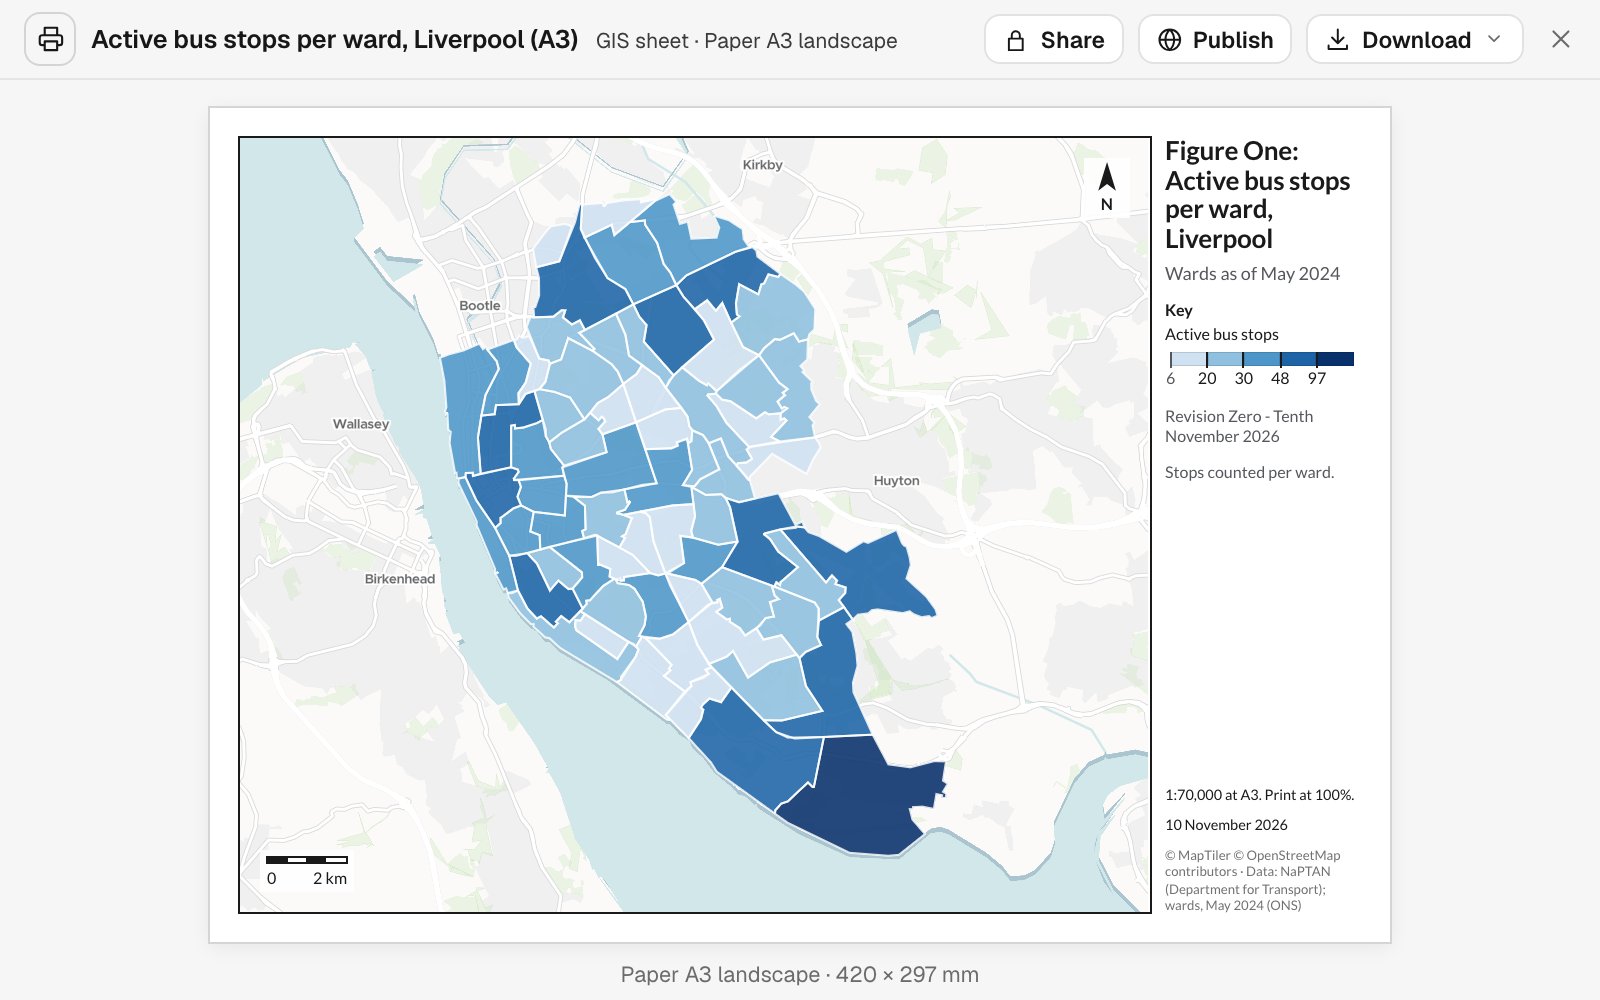
- A title panel. What the sheet shows, its date and its revision.
- A key that matches the map. Checked against what is drawn before the sheet is saved.
- Scale bar and north arrow. The scale is measured, so it holds when printed at full size.
- Sources and credits. Where the data came from, on the sheet itself.
- Yours to download. As a PDF at true size or a PNG, or straight to the printer.
Ask for the page you have to hand in
Four requests, as someone would type them, and what came back.
Write it up for the people who decide
Arrow, a bus operator reviewing its network
The request
Write a report for the network committee on how many residents live within a 400-metre walk of an active stop, area by area. Lead with the areas that fall short, and put the method and sources at the end.
What came back
- The headline finding and three key points
- A table and a map for each section
- Method, sources and the date of the data, last
Brief a team from one sheet of paper
An incident management team briefing its crews during a wildfire
The request
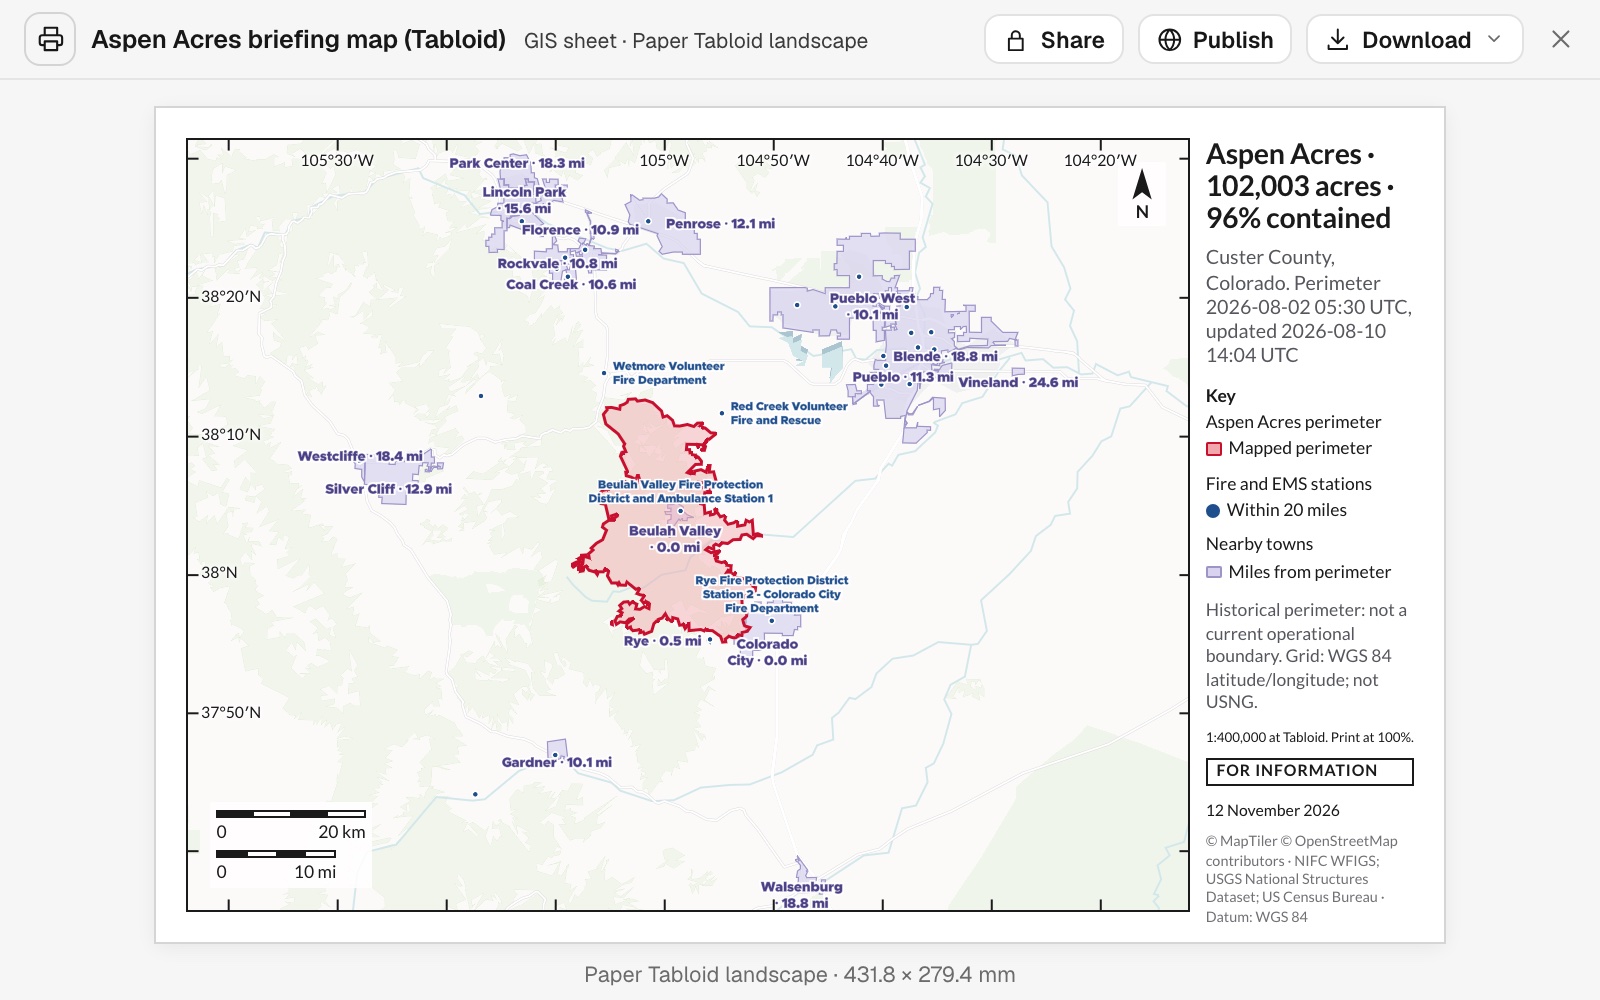
Make a Tabloid landscape briefing sheet of the fire perimeter. Label the fire and EMS stations and the towns within 20 miles with their distance from it, and add a lat/long grid, a scale bar in miles and kilometres, and a “for information” stamp.
What came back
- The perimeter, with nearby stations and towns labelled by distance
- A grid, a scale bar in both units and a status stamp
- A PDF at true size, ready for the plotter
Put one finding on one page
Clearsky, an air-quality charity publishing its yearly findings
The request
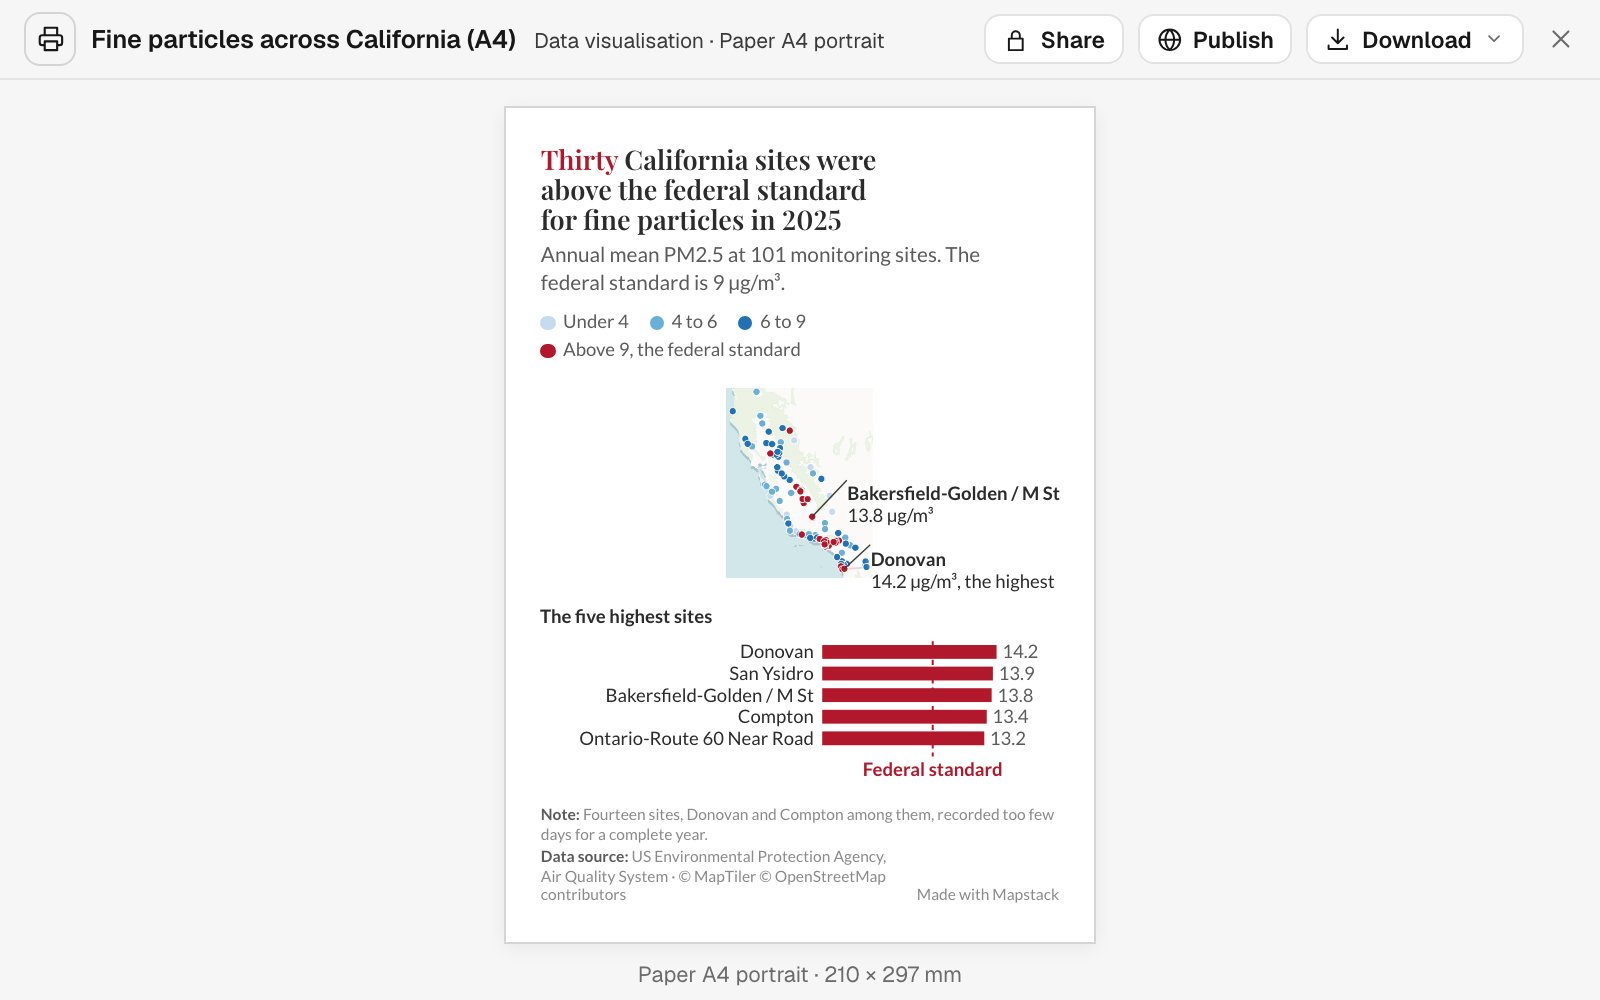
Make an A4 poster of the monitoring sites that were above the standard for fine particles last year. Say how many in the title, mark the highest, and chart the worst five.
What came back
- A title that states the finding
- The highest sites called out on the map
- One chart, with the standard marked on it
Make it fit the feed
Pretzel Hatch, a bakery chain reviewing its sites
The request
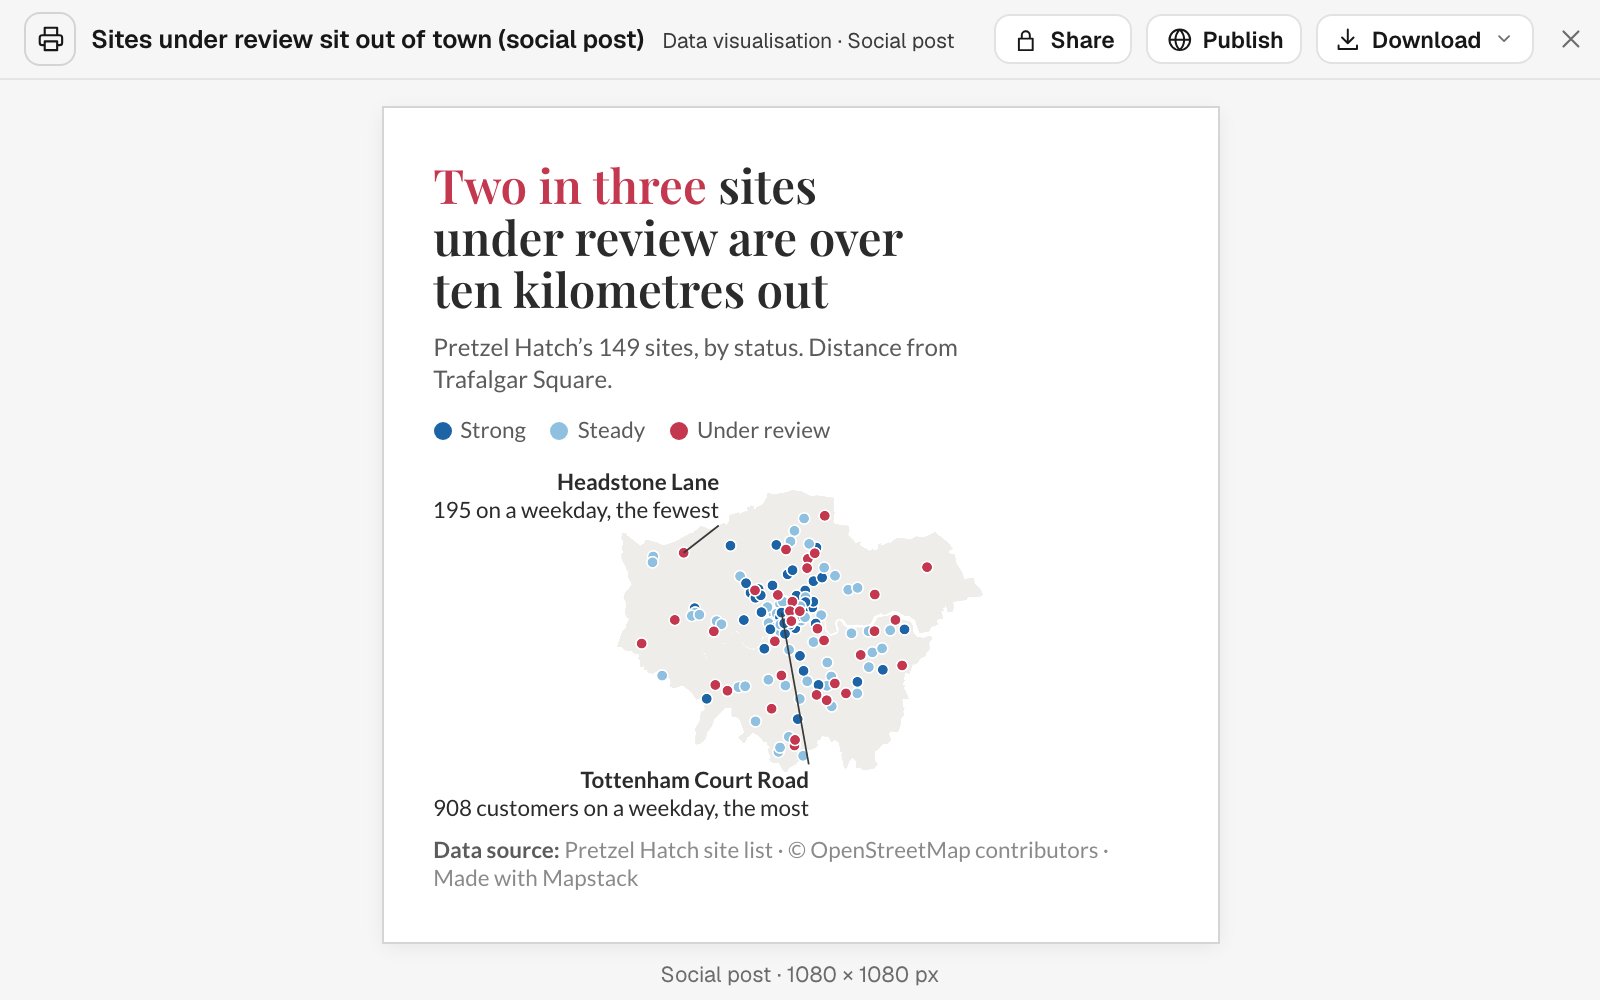
Make a square post showing which of our sites are under review. The title should say what share of them are out of town, and label the busiest and the quietest.
What came back
- Square, at the size the feed wants
- The share worked out and stated in the title
- The busiest and the quietest site labelled on the map
Fits the way your work already leaves the building
The sizes people ask for, in the files they expect.
- On paperAt true size and print resolution, in the scale you name.
- A4A3LetterTabloidPortrait or landscape
- On screenLaid out for the place it will be seen.
- SlideSocial postStoryFigure at a set widthA report by link
- What you take awayFiles other people can open, edit and print.
- WordPDFPNGStraight to the printer
Mapstack lays it out. You approve what goes out.
You would read a colleague’s draft before it went to the board. It works the same way here.
- Every figure has a source. A report with a number it cannot trace is not handed over.
- Findings and reading kept apart. Where a report interprets the data, it says so in plain words.
- Checked before it is saved. Nothing clipped, nothing overlapping, the key matching the map and the scale measured.
- It says what it left out. Anything that could not be included is listed, not passed over.
- Your edits, your way. Ask for a revision, or open the Word file and finish it yourself.
An example of how it goes
Asked at 4:40. In the deck by 4:52.
Kenji is the GIS analyst at a bike-share operator. At twenty to five his director asks for a slide on dock density for tomorrow’s board meeting.
- docks-by-district
Make a slide of docks per square kilometre by district. Put the finding in the title.
Wednesday 4:40
He asks
One sentence, from the analysis he finished last week. No layout window opened.
Wednesday 4:47
The slide is back
The finding is the title. The map, the key and the sources are in place.
Add a chart of the ten densest districts.
Wednesday 4:50
He asks for one change
The chart is added beside the map. Everything else stays where it was.
- Downloaded as
PDF · 1920 × 1080
Dropped into the board deck
Wednesday 4:52
He sends it
Downloaded at slide size and dropped straight into the deck.
Kenji left on time.
A slide like that used to mean an evening of exporting, cropping and nudging labels. The analysis was already done. Now the write-up is as well.
The jobs this gets done
- Write the decision report for a committeeEvery area ranked, the first few recommended, with a map, the full table and a method note.
- Write the evidence of need for a funding bidOfficial figures for your area against the city, as a report a funder reads.
- Make the study-area figure for a paperSites, rivers, a locator inset and a scale bar.
- Turn a map into a figure that meets your standardA title block, a scale statement and a revision.
- Make the map for the next incident briefingThe latest perimeter, laid out on a sheet to print.
- Put a site and its selling points on one pageA property infographic: the site, the stations and who lives nearby, on A4.
What it costs
Mapstack is priced per person. Reports and prints come with a Creator seat; anyone you send the file to needs nothing.
Free
$0for one person
Make maps and run analysis on your own files. Private to you until you choose to publish.
Creator
$16a person a month, billed yearly
Adds reports, print-ready map sheets, slides and figures, and private sharing with your team.
Creator Max
$80a person a month, billed yearly
The same, with a larger monthly allowance for people who publish every day.
Colleagues who only read what you make take a Viewer seat at $10 a month. They open and download every report and print, and can ask where any figure came from. See every plan.
Common questions
What goes into a report?
A title and headline, key points, sections with text, tables, charts and still maps, a conclusion and recommendations where the question calls for them, and a closing section on the data: the method, the sources and the date.
Which page sizes and formats can I get?
Paper at A4, A3, Letter or Tabloid; a slide; social posts and stories; and figures at set widths for a document or a journal. Reports download as Word or PDF. Prints download as PDF or PNG.
Is the scale on a map sheet accurate?
Yes. A map sheet is drawn at true size at print resolution, the scale is stated, and the scale bar is measured before the sheet is saved. Print it at 100% and it holds.
Can I edit the result myself?
A report downloads as a Word file that uses Word’s own styles, so you can finish it by hand. For a print, say what should change and it is reissued.
Does a report change when my data changes?
No, on purpose. A report or a print is a dated record of what the data showed. When the data moves on, ask for it again and you get a new one.
Which plan do I need?
Making reports and prints needs a Creator seat. Viewers can read and download them.
Is the data I upload private?
Yes, on every plan, Free included. Your files and everything made from them are private to your workspace by default. Nothing is public unless you choose to publish it, and you can make it private again.
What happens to my data?
It stays in your workspace and it stays yours. Only the people you give a seat to can see it. It is stored in the United States, it is not used to train AI, and when you delete it, it is removed.
Ask for your first report.
Free to start. Reports and prints on a paid seat.