
Flood exposure by zone
Add up the property value in each flood zone.
Attach your properties with their values, and the flood zones for your area. You get the properties counted and their value totalled in each zone, and a map by zone.
Free to start. Printed maps on a paid seat.
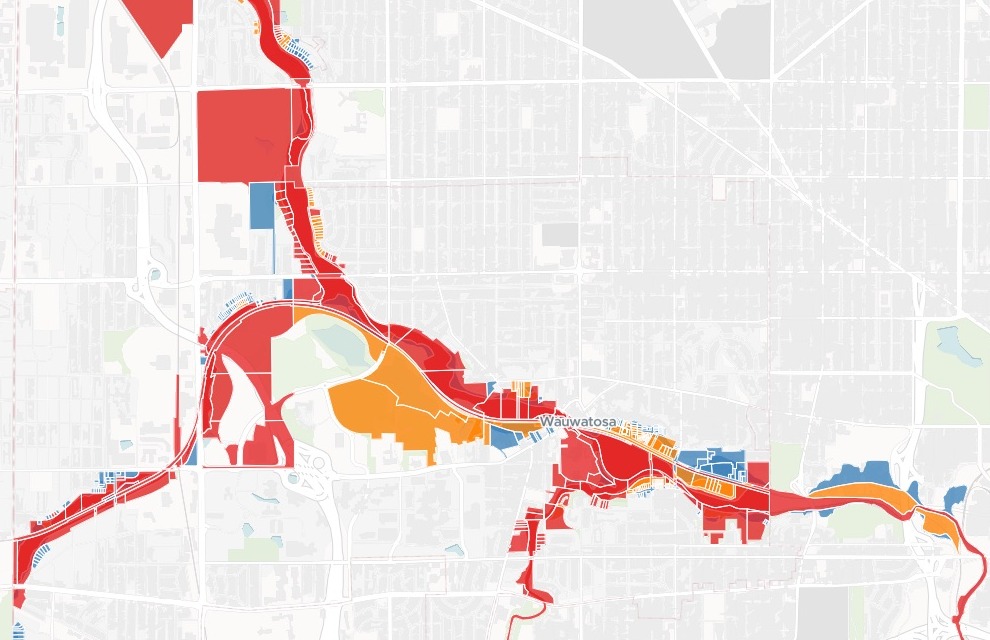
| Assessed value in each zone | Value |
|---|---|
| Floodway | $153.9M |
| Zone AE (1% annual chance) | $112.6M |
| 0.2% annual chance | $144.1M |
472 parcels touch a flood zone.
For whoever has to say what a flood would hit
Mitigation plans.Insurance portfolios.A landlord’s buildings.The properties are in one file and the flood zones in another.
The question is how much sits in each zone.
Insurers call it exposure accumulation: the value at risk, added up zone by zone. A hazard mitigation plan asks the same of a whole city.
Here you attach the two files. Mapstack lays one over the other, does the sums and maps every property it counted.
One real city
What sits in Wauwatosa’s floodplain
The City of Wauwatosa, Wisconsin, on the Menomonee River: the city's tax parcels from the 2025 assessment roll, against FEMA's flood zones. Insured values are not public, so the parcels' assessed values stood in for them.
- In the 1% floodplain
- $266.4Mof assessed value: the floodway and zone AE together
- Of that, buildings
- $196.6Mand $69.8M in land
- Share of the city
- 2.61%of all Wauwatosa’s assessed value, $10.2 billion
| Each zone | Homes | Parcels |
|---|---|---|
| Floodway | 40 | 162 |
| Zone AE, the rest of the 1% floodplain | 116 | 149 |
| 0.2% annual chance | 122 | 161 |
The floodway has the most parcels and the fewest homes.
Each zone’s parcels, homes, and land, building and total value came back in one table, with the order of severity stated.
Wisconsin State Cartographer’s Office, Wisconsin Statewide Parcel Map Database, version 12 (2025 tax roll), City of Wauwatosa; owner names removed before attaching. FEMA flood zones from the City of Milwaukee’s FEMA floodplain map. Run on 15 November 2026.
From a tax roll and a flood map to the value in each zone
Columns: Parcel ID (its number), Address (its street), Land value (as assessed), Building value (as assessed), Total value (the two), Property class (home, shop or works). 16,161 rows. Each with its outline. The flood zones come as a second file: each area’s FEMA zone, and whether it is floodway.
What you get
- Each zone’s parcels and homes, with their land, building and total value.
- The 1% floodplain as one figure, and its share of the whole city.
- The exposed parcels as their own dataset, with address, zone and values.
- A map by zone, with a filter by zone and search by address or parcel ID.
How it goes
You bring the two files and the rule. Mapstack does the rest.
Attach both files and say how to count.
Mapstack maps every parcel it counted.
You get the totals, zone by zone.
Common questions
How does it count?
Any part counts. Here a parcel was in a zone if any part of it lay there, as the request asked.
Once, in the worst zone. Floodway, then zone AE, then 0.2%, so nothing is counted twice.
The values you attach. Here the tax roll’s assessed values. For an insurer, the schedule of values.
What does it cost?
Free to start. One seat, for you, with a starter amount of work each month. No card.
The totals, the table and the map are on the free seat. With your own files and public sharing.
Printed maps are on a paid seat. Paid seats are per person, and bring more work each month.
The prices are on the pricing page.
What happens to our property data?
It stays in your workspace. Only people with a seat in your workspace can see it. Nothing leaves unless you publish it yourself.
It is not used to train AI. Your data and your conversations are not used to train AI models.
It is still yours. You keep ownership of what you bring in. Delete it and it is removed.
The full answer is in the documentation: Your data, privacy and security.
Total yours.
Free to start. Printed maps on a paid seat.