
Change over time, area by area
See where the numbers rose, and where they fell.
Attach a table with a column for each year. You get every area’s change on a map, rises and falls in two colours, and the biggest ranked.
Free to start. No card.
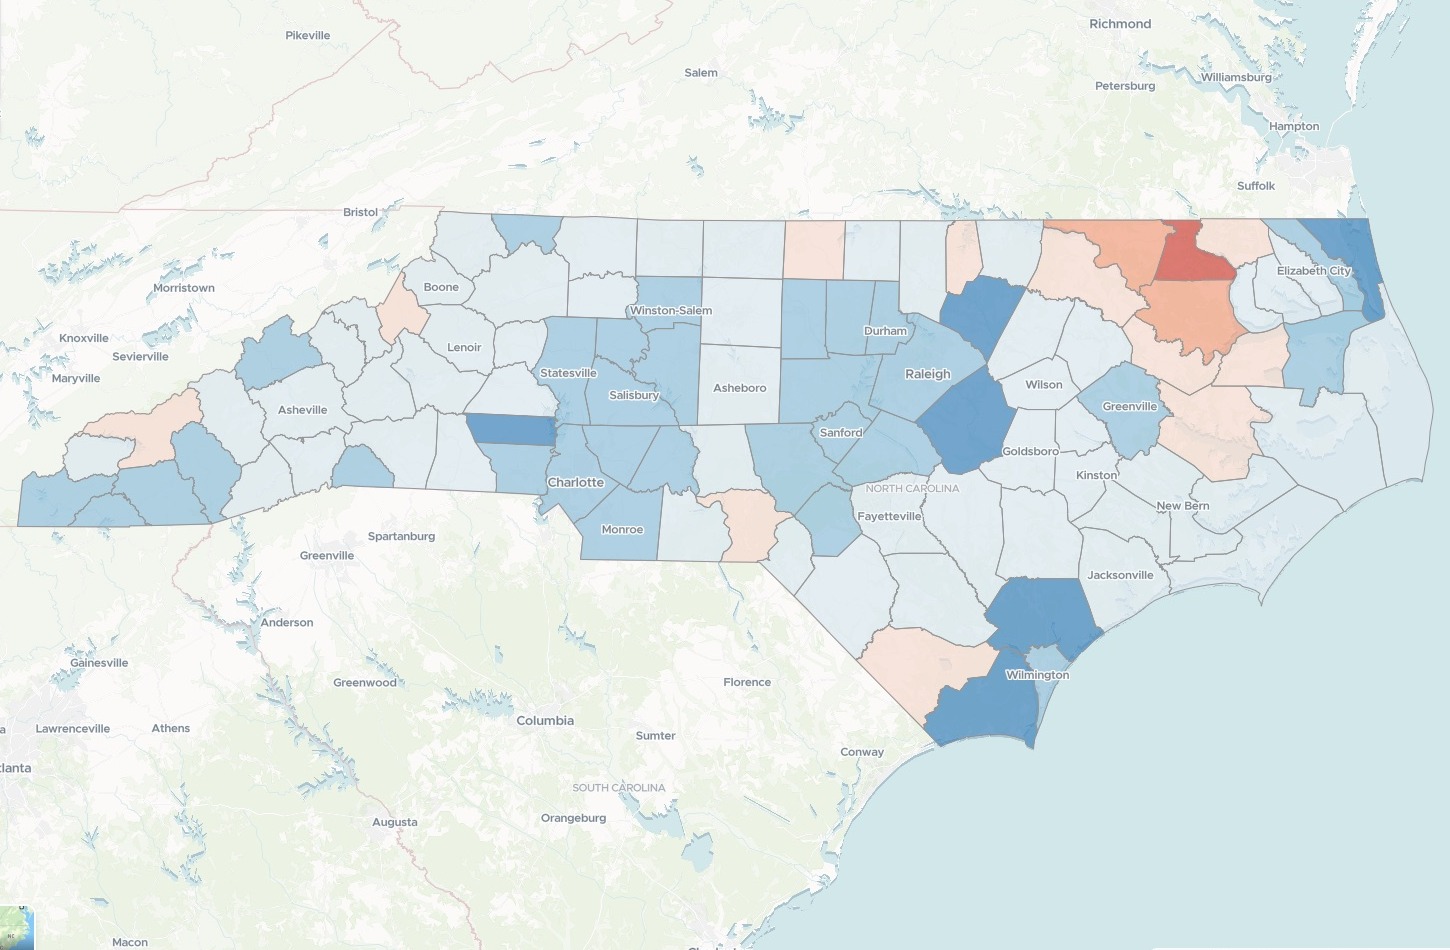
| Population, 2020 to 2024 | Change |
|---|---|
| Fastest growth | +20.95% |
| Steepest loss | −12.02% |
| Statewide | +5.71% |
Brunswick, on the south-east coast, grew fastest; Hertford, in the north-east, lost most.
For anyone who reports what changed, place by place
Residents by county.Pupils by school.Sales by region.The figures come a column a year.
The question is where they went up, and where they went down.
A briefing on change needs both halves: a map where rises and falls are told apart at a glance, and the ranked lists behind it, in percent and in real numbers.
Here you attach the table. Mapstack does the arithmetic, the map and the ranking.
From a column a year to a map of the change
Columns: County code (the area’s code), County name (its name), Population, 2020 (the first year), Population, 2024 (the last, with a column for each year between). 100 rows. One row for each area, a column for each year, and no shapes.
What you get
- A map of every area, shaded by its change: rises in blue, falls in red.
- The change for each, in number and in percent, and for the whole.
- The ranking: the ten at each end, both ways, and how many fell.
- Every year’s figure in each area’s card, when someone selects it.
One real table
Where North Carolina grew, and where it shrank
The Census Bureau's population estimates for all 100 North Carolina counties, a column a year from July 2020 to July 2024. Nothing else was attached: Mapstack fetched the county boundaries itself.
- The whole state
- +596,372residents between July 2020 and July 2024
- Most people added
- +101,750in Wake County, the most of any county
- Most people lost
- −2,618in Hertford County, the most of any county
- Grew
- 86
- Lost people
- 14
It ranks both ways.
By percent, the list is led by the counties around the cities and on the coast; by people, by the cities themselves. Mapstack gave the ten at each end both ways, each with its 2020 and 2024 estimates, the net change and the percent.
US Census Bureau, county population estimates (Vintage 2024), North Carolina: the estimates for July 1 of each year, 2020 to 2024. Boundaries fetched by Mapstack. Run on 14 November 2026.
Put the break at zero
Say where the colours should change, and the classes follow.
Classes set by hand are called manual breaks. A scale that runs from one colour through pale to another, around a midpoint, is a diverging colour scale.
Put the break exactly at zero, so every county that lost population is in shades of red and every county that gained is in shades of blue.
Mapstack set the class breaks by hand with 0% as the exact dividing line. Every county with a net loss is in red, every county that grew in blue, and no county that grew slightly shares a colour with one that shrank.
How it goes
You bring the years. Mapstack works out the change.
Attach your figures by year and say what to rank.
Mapstack maps every area by its change.
You get the rankings. Here, the most people added after Wake.
Common questions
What happens to our figures?
It stays in your workspace. Only people with a seat in your workspace can see it. Nothing leaves unless you publish it yourself.
It is not used to train AI. Your data and your conversations are not used to train AI models.
It is still yours. You keep ownership of what you bring in. Delete it and it is removed.
The full answer is in the documentation: Your data, privacy and security.
What does it cost?
Free to start. One seat, for you, with a starter amount of work each month. No card.
This job is on the free seat. Maps, datasets, analysis, your own files and public sharing are all included.
Pay per person for more. A paid seat brings more work each month, and seats for your team.
The prices are on the pricing page.
Do I need to bring the boundaries?
No. Attach the table alone. Here Mapstack found the county boundaries itself and joined them to all 100 rows.
See what changed in yours.
Free to start. No card.