
Response coverage and drive-time analysis
See how much of your city each station reaches.
Tell Mapstack the stations and the target. You get the area each station reaches on a map, and the residents counted inside and outside.
Free to start. Written reports on a paid seat.
| Residents | People |
|---|---|
| Within 4 minutes | 487,300 |
| Outside | 228,222 |
| Only FS-24 reaches | 4,578 |
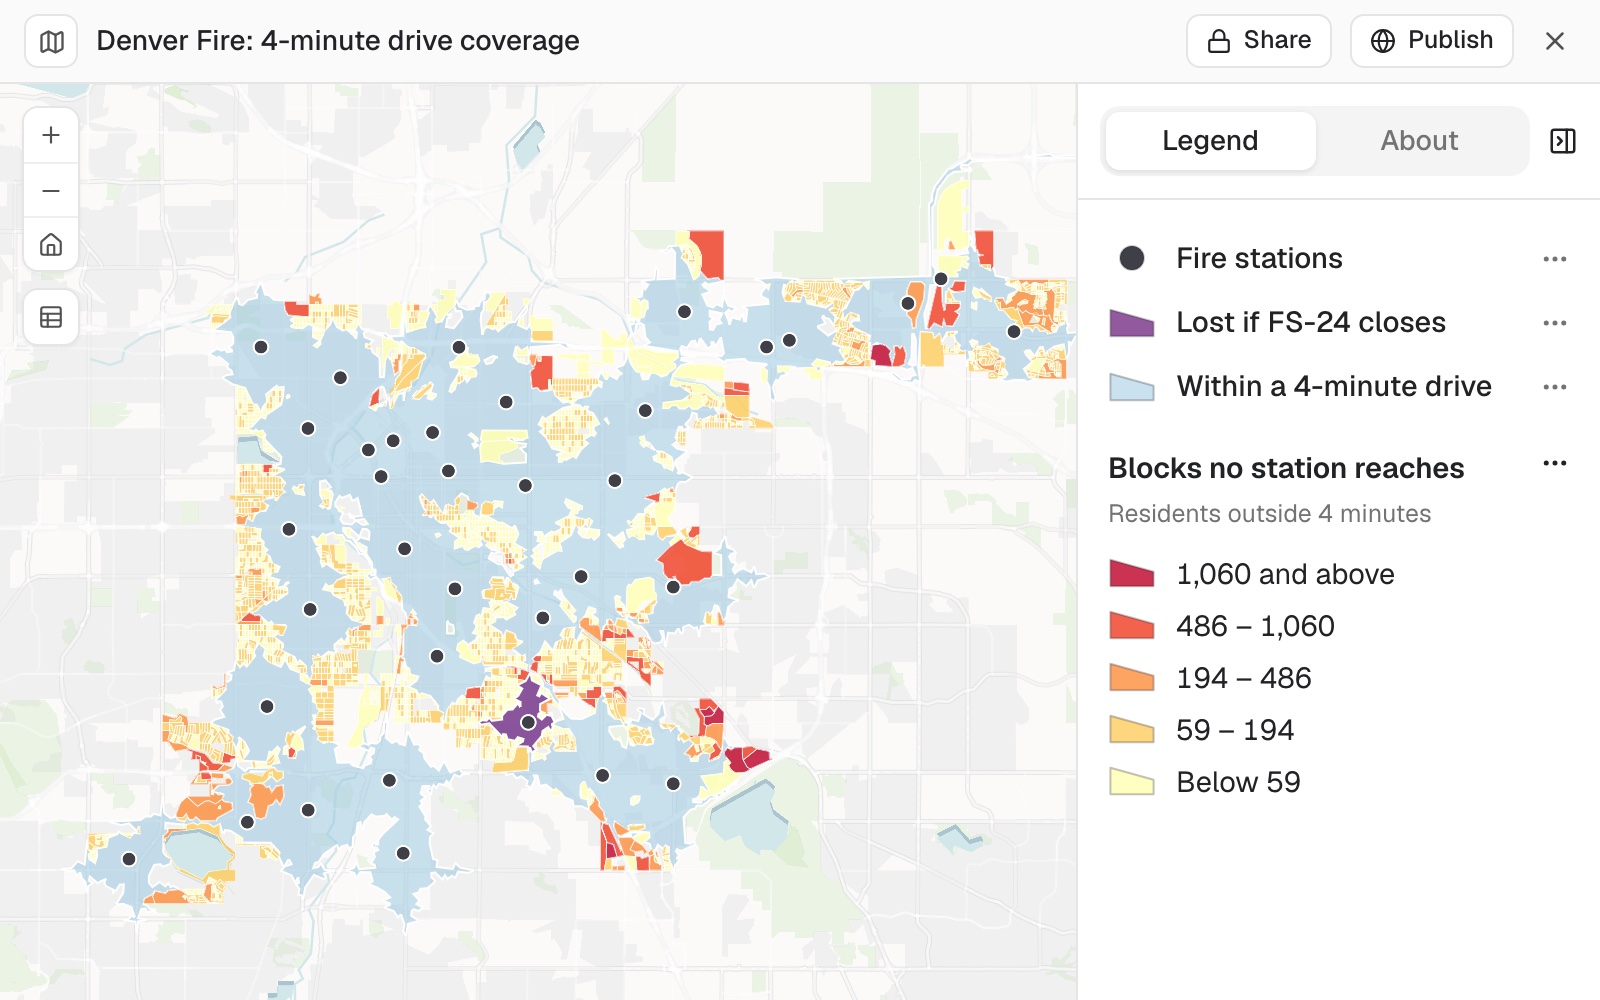
68.1% of residents are within 4 minutes. Closing FS-24 takes that to 67.5%.
For whoever has to defend the map
A budget round.A proposal to close a station.A council that wants to know who would wait longer.
You need the number, and the method behind it.
The usual answer is a consultant's study, or a ring drawn round each station that ignores the roads.
This gives you the coverage, the gap and the closure test, written up with its assumptions stated.
One real city
41 stations, 715,522 residents, a 4‑minute target
Nothing attached. Mapstack found Denver Fire Department's stations in the city's open data, and the 2020 Census population for every block.
- Reached
- 68.1%of residents within a 4-minute drive of a station
- Not reached
- 228,222residents, in 3,434 blocks or parts of blocks
- At stake
- 4,578residents that only station FS‑24 reaches
| Station | Residents within 4 minutes | Reached by no other station |
|---|---|---|
| FS-6, downtown | 37,657 | 287 |
| FS-24, S Colorado Blvd | 4,722 | 4,578 |
The station with the fewest people in its area is not the one that costs least to close.
FS-6 has 37,657 residents within 4 minutes, and its neighbours reach all but 287 of them. FS-24 has 4,722, and 4,578 are reached by no other station. Mapstack set out both readings of "fewest", and what each closure would lose.
Stations: City and County of Denver open data. Population: 2020 US Census, by block. Roads: OpenStreetMap. Run on 11 November 2026.
How it goes
You set the target and ask the question. Mapstack does the drive times and the counting.
Name the stations and the target.
Mapstack draws each area and counts who is inside and who is left out.
You test a closure and get the write-up.
The step-by-step guide is in the documentation: Map how much of the population each fire station reaches in time.
Coverage is where it starts
The same request stretches further. Each of these is something you can ask for today.
Change the target
Another time, another service.
- Use an 8-minute drive.
- Do the same for our ambulance stations.
Bring your incidents
Residents are one measure. Calls are another.
- Here are last year's incidents. What share were within 4 minutes of a station?
Test a change
Before the meeting, not after.
- Which station covers the fewest people that no other station reaches?
- What do we lose if FS-24 closes? Show the before and after.
- Write it up for the standards of cover document.
Common questions
What happens to our data?
It stays in your workspace. Only people with a seat in your workspace can see it. Nothing leaves unless you publish it yourself.
It is not used to train AI. Your data and your conversations are not used to train AI models.
It is still yours. You keep ownership of what you bring in. Delete it and it is removed.
The full answer is in the documentation: Your data, privacy and security.
What does it cost?
Free to start. One seat, for you, with a starter amount of work each month. No card.
The coverage map and the counts are on the free seat. With your own files and public sharing.
The written report is on a paid seat. Paid seats are per person, and bring more work each month.
The prices are on the pricing page.
How is coverage counted?
A drive-time area for each station. It follows the roads. Mapping people call it an isochrone.
Nobody counted twice. Overlapping areas are merged into one footprint before anyone is counted.
Residents by census block. Where a block is cut by the edge, the share of the block's area inside is counted.
Assumptions stated. Drive time on OpenStreetMap roads at ordinary speeds, with no traffic, sirens or signal priority. The write-up says so, and says what the figures do not show.
Measure yours.
Free to start. Written reports on a paid seat.