
An incident map, counted by area
Put your incident log on a map, area by area.
Attach the log and your area boundaries. You get every record on a map, a count for each area by type, and how many could not be placed.
Free to start. Sheets and slides on a paid seat.
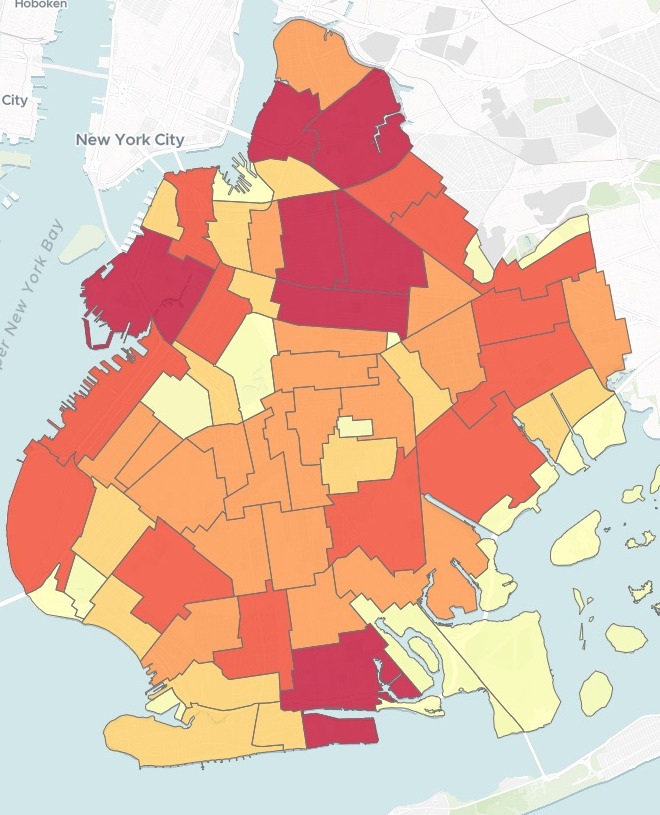
| Complaints per neighborhood | |
|---|---|
| 275 and above | |
| 191 – 275 | |
| 114 – 191 | |
| 41 – 114 | |
| Below 41 |
Mapstack said what it could not place: 269 rows with no coordinates, and 6 just beyond the shoreline.
For whoever reports on the log
A month of complaints in a spreadsheet.
A cabinet, a board or a council that wants to know where, how many and what kind.
Every record is counted into the neighborhood it falls in, and each neighborhood is shaded by its count: the darker, the more complaints.
Here you attach the log and the boundaries, and ask in a sentence. Complaints, fire calls, crimes, trap counts: any log with a location works the same way.
One real month
Every sanitation complaint in Brooklyn for October, counted
9,383 complaints to New York City's 311 line handled by the Department of Sanitation in Brooklyn, from NYC Open Data, and the city's 2020 neighborhood boundaries. Mapstack used the two files and nothing else.
- Busiest
- 380complaints in Williamsburg, the most of any neighborhood
- Top complaint
- 2,144for a dirty condition, nearly a quarter of the borough's total
- Second type
- 1,304for illegal dumping (fly-tipping), which got a map of its own
| The ten busiest | Share of its complaints | Main complaint |
|---|---|---|
| Williamsburg | 27.6% | Dirty |
| East Williamsburg | 27.1% | Dirty |
| Bedford-Stuyvesant (West) | 35.6% | Dirty |
| Crown Heights (North) | 39.4% | Dirty |
| Carroll Gardens-Cobble Hill-Gowanus-Red Hook | 22.7% | Dirty |
| Bedford-Stuyvesant (East) | 25.2% | Dirty |
| Sheepshead Bay-Manhattan Beach-Gerritsen Beach | 33.5% | Dirty |
| Bay Ridge | 19.9% | Dirty |
| Sunset Park (West) | 25.5% | Dirty |
| Downtown Brooklyn-DUMBO-Boerum Hill | 52.7% | Vendor |
It found the exception without being asked.
Dirty Condition led in nine of the ten busiest neighborhoods. In Downtown Brooklyn-DUMBO-Boerum Hill it was Vendor Enforcement, and Mapstack made that its key takeaway for the cabinet.
NYC Open Data, 311 Service Requests, Department of Sanitation, Brooklyn, created 1 to 31 October 2026. NYC Department of City Planning, 2020 Neighborhood Tabulation Areas. Run on 14 November 2026.
Pull out the one you will be asked about
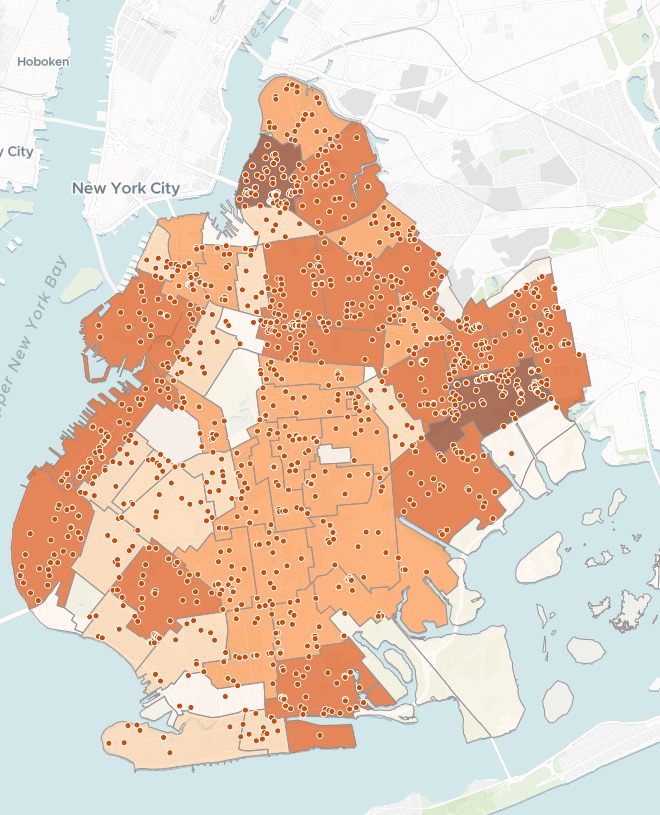
"Make me a second map of just the illegal dumping complaints per neighborhood, and list the five neighborhoods with the most."
- East New York-New Lots led with 77, then Williamsburg with 67 and Sunset Park (West) with 50.
- Every dumping complaint is a dot: click one for its street address, the kind of dumping, the date and the status.
- A note it added itself: the two East New York sections held nearly 10% of the borough's dumping.
How it goes
You bring the log and the boundaries. Mapstack does the placing and the counting.
Attach the log and your area boundaries.
Mapstack places every record and counts each area.
You get a map to share.
Then take it into the room
For the meeting, and after it.
A sheet to hand round
One page for the meeting.
- Write a one-page printable briefing sheet from these findings.
A slide
For the briefing deck.
- Make a slide graphic of the illegal dumping map.
A link
For everyone after the meeting.
- Publish the map so the cabinet members can open it from a link.
Common questions
What happens to our log?
It stays in your workspace. Only people with a seat in your workspace can see it. Nothing leaves unless you publish it yourself.
It is not used to train AI. Your data and your conversations are not used to train AI models.
It is still yours. You keep ownership of what you bring in. Delete it and it is removed.
The full answer is in the documentation: Your data, privacy and security.
What does it cost?
Free to start. One seat, for you, with a starter amount of work each month. No card.
The maps, the counts and the link are on the free seat. With your own files and public sharing.
A briefing sheet or a slide is on a paid seat. Paid seats are per person, and bring more work each month.
The prices are on the pricing page.
What is on the map?
Each area, shaded by its count. Click one for its total, its district and its main complaint.
Every record. On a second layer, coloured by type.
Search. Find a neighborhood or an address.
Map yours.
Free to start. Sheets and slides on a paid seat.