
Grant funding per head, by area
See where the money went, per head.
Attach your spending totalled by area. You get the amount per head for every area, ranked and mapped, with one figure for the whole country.
Free to start. Reports and prints on a paid seat.
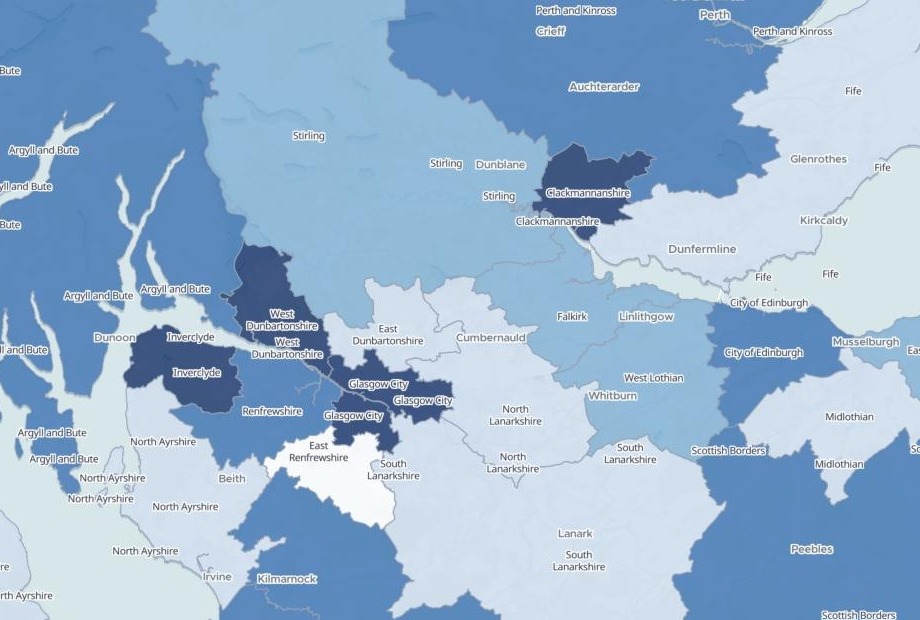
| Grants per head | 2024–25 |
|---|---|
| West Dunbartonshire | £24.24 |
| Scotland overall | £10.97 |
The highest of the 32 council areas, against the country as a whole.
For anyone who has to show where the money went
A funder reporting to its board.A council comparing itself with its neighbours.The totals are in a spreadsheet.
The fair comparison is per person.
Big places get the most money because more people live there. Dividing each area’s total by its population, per head or per capita, shows which areas got more than their share and which got less.
From a table of totals to pounds per head
Columns: Council Area (the area’s name), Council Area Code (its official code), Total Awarded (GBP) (the money, totalled), Number of Grants (how many grants). 32 rows. One row for each area, and no population.
What you get
- Pounds per head for every area, and for the whole country.
- The ranking, with the five highest and the five lowest named.
- A map shaded by pounds per head, with a ranked chart and the full table linked to it.
- Each area’s figures: total, grants, population and per head, when someone selects it.
One real year of grants
Glasgow got the most money. Not the most per person.
The National Lottery Community Fund’s published grants for April 2024 to March 2025: £59,654,899 to organisations in Scotland, totalled by each recipient’s council area.
- Ahead of Glasgow per head
- 3council areas with far fewer people: West Dunbartonshire, Clackmannanshire and Inverclyde
- Below the Scottish figure
- 19 of 32council areas got less per person than Scotland as a whole
- Three lowest per head
- North-eastMoray, Aberdeenshire and Aberdeen City
| The five that got the most | Awarded | Per head |
|---|---|---|
| Glasgow City | £11,957,627 | £19.26 |
| City of Edinburgh | £6,833,684 | £13.28 |
| South Lanarkshire | £2,655,357 | £8.12 |
| Renfrewshire | £2,557,161 | £13.91 |
| North Lanarkshire | £2,519,173 | £7.39 |
Per head turns the list round.
Glasgow City and Edinburgh got the most money. South and North Lanarkshire, third and fifth for money, got less per person than Scotland as a whole.
The National Lottery Community Fund, grants awarded April 2024 to March 2025, published to the 360Giving standard (Open Government Licence). Population: census figures from National Records of Scotland, fetched by Mapstack. Run on 15 November 2026.
How it goes
Attach your totals by area and ask for the amount per head.
Mapstack adds the population and maps pounds per head.
You get every area, ranked. Here, the next lowest after Moray.
Common questions
What happens to our figures?
It stays in your workspace. Only people with a seat in your workspace can see it. Nothing leaves unless you publish it yourself.
It is not used to train AI. Your data and your conversations are not used to train AI models.
It is still yours. You keep ownership of what you bring in. Delete it and it is removed.
The full answer is in the documentation: Your data, privacy and security.
What does it cost?
Free to start. One seat, for you, with a starter amount of work each month. No card.
The per-head figures, the ranking and the map are on the free seat. With your own files and public sharing.
A board report or a printable map is on a paid seat. Paid seats are per person, and bring more work each month.
The prices are on the pricing page.
Where does the population come from?
Mapstack fetches it. For every area in your table, from the census: here, National Records of Scotland.
It is kept as a dataset. The population sits in your workspace beside your totals.
Show where yours went.
Free to start. Reports and prints on a paid seat.