
An operations dashboard
Build one screen of what is happening where.
Attach your open work. You get one screen with a map, charts and filters, at one link. Some call it a common operating picture.
Free to start. Routines on a paid seat.
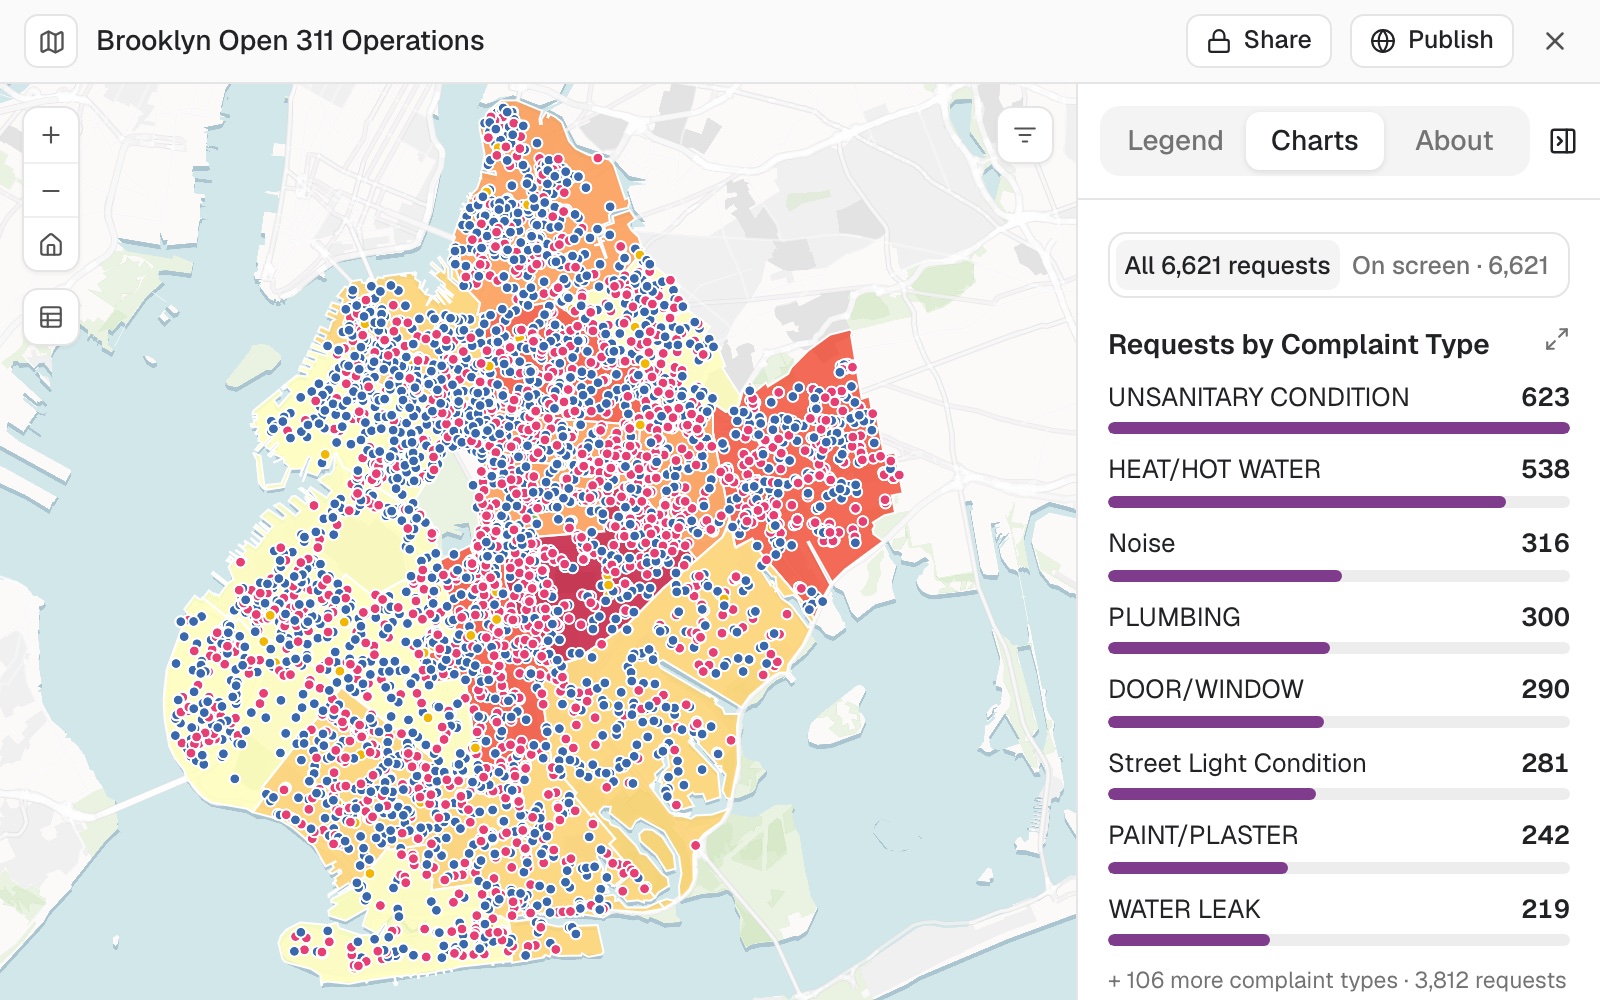
| One week of open requests | |
|---|---|
| On the map | 6,621 |
| Most open, District 17 | 417 |
| Unsanitary condition, the top type | 623 |
87 rows in the file had no coordinates. Mapstack named them and offered the list.
For whoever runs the operation
Service desks.Maintenance and field teams.Programme managers.The work is in a system.
Where it is, and where it is piling up, is not.
Counts by area tell a manager where to send people. A chart of request types tells them what kind.
Here one map carries both, with filters, and the team opens it from one link.
One real week
6,708 open requests, one screen
NYC Open Data's 311 service requests for Brooklyn, created in one week and not yet closed. Mapstack fetched the community district boundaries itself.
- In the file
- 6,708open requests, one row each
- Reported
- 87rows with no coordinates, named, not dropped quietly
- Named
- 5districts with the most open requests, and the 3 with the fewest
| Requests by type | Requests |
|---|---|
| Unsanitary condition | 623 |
| Heat or hot water | 538 |
| Noise | 316 |
| Plumbing | 300 |
| Door or window | 290 |
Rows with no location are named, not dropped.
The file has 6,708 rows and the map 6,621. Asked why, Mapstack said the other 87 have no coordinates in the source, gave the count for each status, and added a chart of open against in progress.
NYC Open Data, 311 Service Requests, Brooklyn, created 4 to 10 November 2026 and not closed. Run on 11 November 2026.
Show which areas are falling behind
Ask for the areas you report on.
To keep it current, a routine fetches the latest records on a schedule and the map shows them.
Add the community district boundaries and show how many open requests each district has, so the team can see which districts are falling behind.
Mapstack fetched the boundaries, counted the open requests inside each district and shaded the districts beneath the points. Each district shows its open, in-progress and total requests. It named the five with the most, led by District 17 with 417.
How it goes
You bring the export. Mapstack builds the screen.
Attach the open work and say what the team needs.
Mapstack builds the screen.
The team opens one link.
The step-by-step guide is in the documentation: Build one screen that shows what is happening where.
Common questions
What happens to our records?
It stays in your workspace. Only people with a seat in your workspace can see it. Nothing leaves unless you publish it yourself.
It is not used to train AI. Your data and your conversations are not used to train AI models.
It is still yours. You keep ownership of what you bring in. Delete it and it is removed.
The full answer is in the documentation: Your data, privacy and security.
What does it cost?
Free to start. One seat, for you, with a starter amount of work each month. No card.
The screen and its link are on the free seat. With your own files and public sharing.
The routine that refreshes it is on a paid seat. Paid seats are per person, and bring more work each month.
The prices are on the pricing page.
What is on the screen?
The map. Every record placed, coloured as you ask, with the full record on selection.
Charts. Counted over all the records, or only those on screen.
Filters and search. Narrow by team or status, find a record by address or ID.
Build yours.
Free to start. Routines on a paid seat.