
Mapstack for real estate
The AI teammate for real estate location analysis.
Ask in plain words. Mapstack makes the map, the site check or the exhibit.
Free to start. No card.
Where real estate stands today
Every property decision is a decision about a location. Getting the evidence is the slow part.
Everyone needs a map, few can make one
Some firms have a few analysts behind many deal-makers. Others have no specialist, and whoever builds the model makes the maps too.
It has to convince someone else
A client, a lender, a partner or a committee asks what each figure rests on. Then the terms move, and the maps are made again.
There is more to check before you commit
Flood, zoning, what is being built nearby. Each new question is another layer to find and another map to make.
Location evidence for every deal, while it is open.
What changes with Mapstack
Today a location question waits for the few people who can make the map, or goes unasked. With Mapstack you ask, and the answer is there while the deal is still open.
Know a location before you commit to it
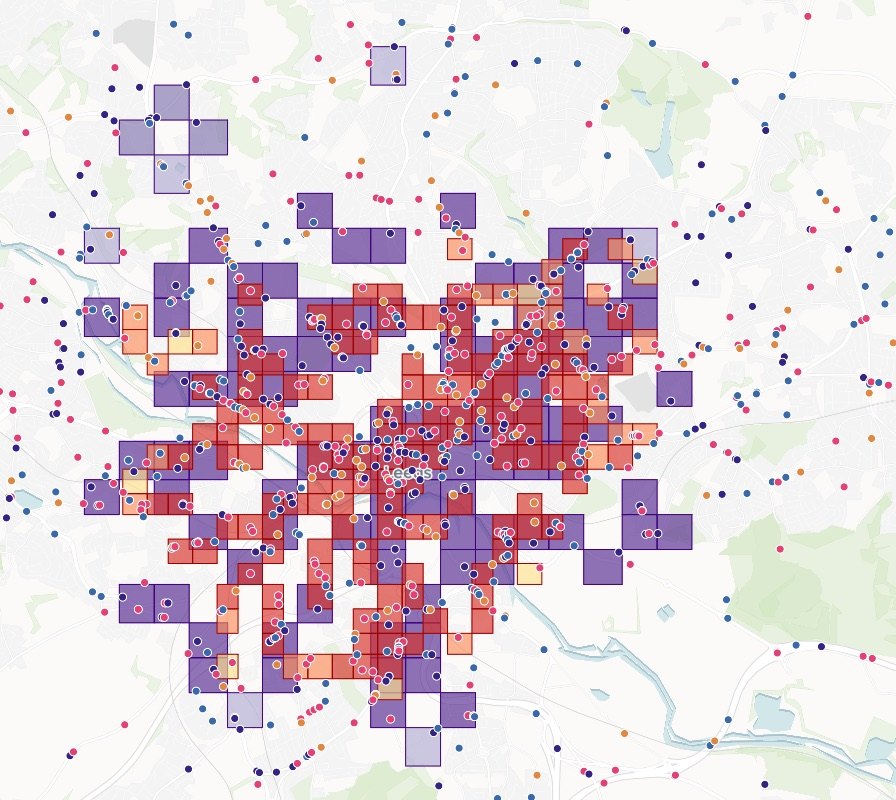
Size up any site, building or neighborhood: who lives within reach, what is nearby, what competes, and how it compares with the others on your list.
- Or ask
Who lives within a 10-minute drive of this center, and what competes there?
Which neighborhoods score highest for walking to everyday places?
Census tracts by walkability score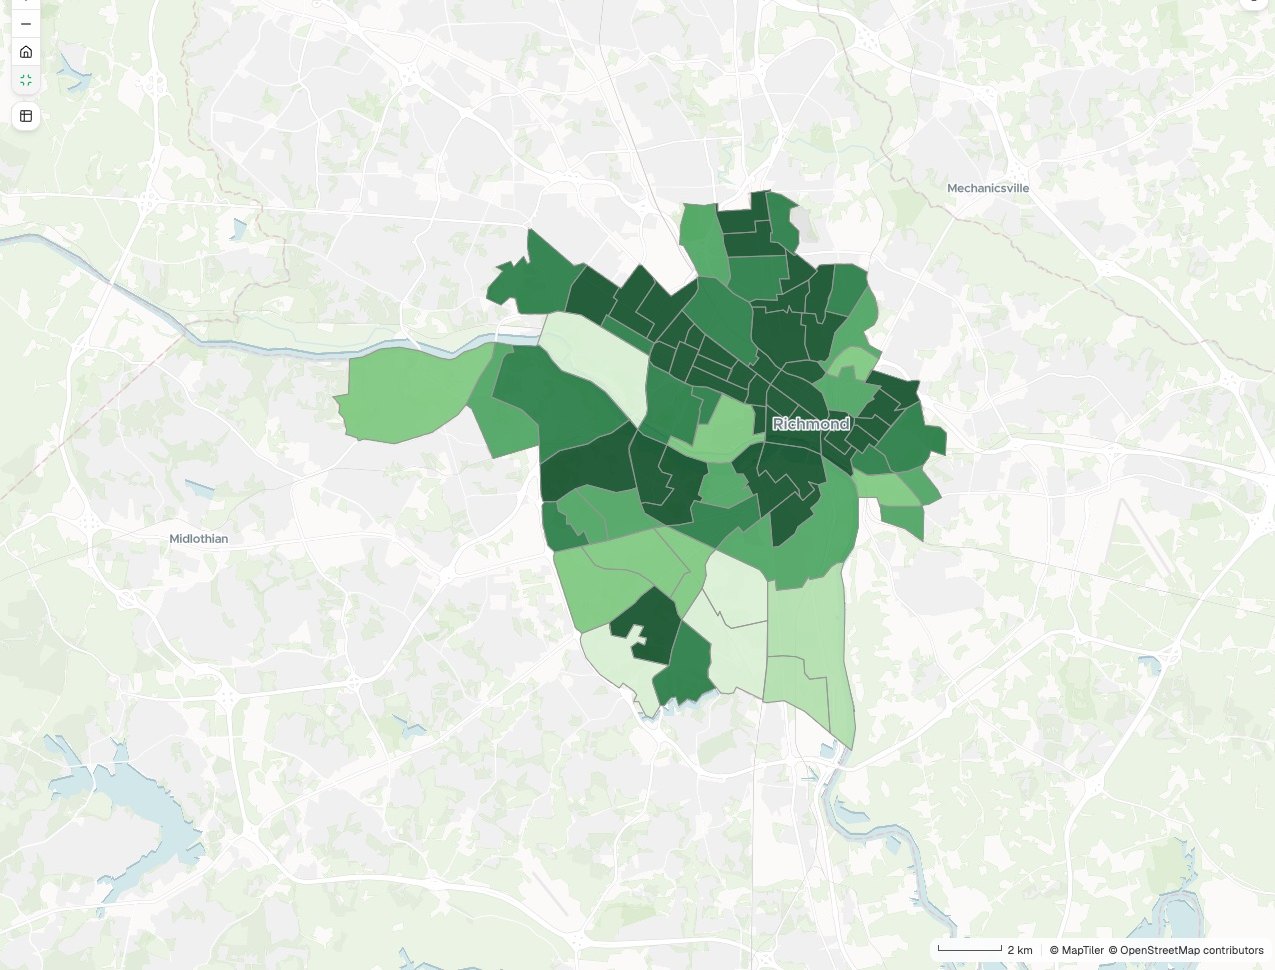
- Or ask
Find what could stop a deal, early
Check one site or a whole portfolio against flood zones, wetlands, zoning and protected land, and see how much of each property is affected.
- Or ask
Which of our buildings touch a flood zone, and how much value sits in each?
Which parcels along the river touch a flood zone?
Parcels by FEMA flood zone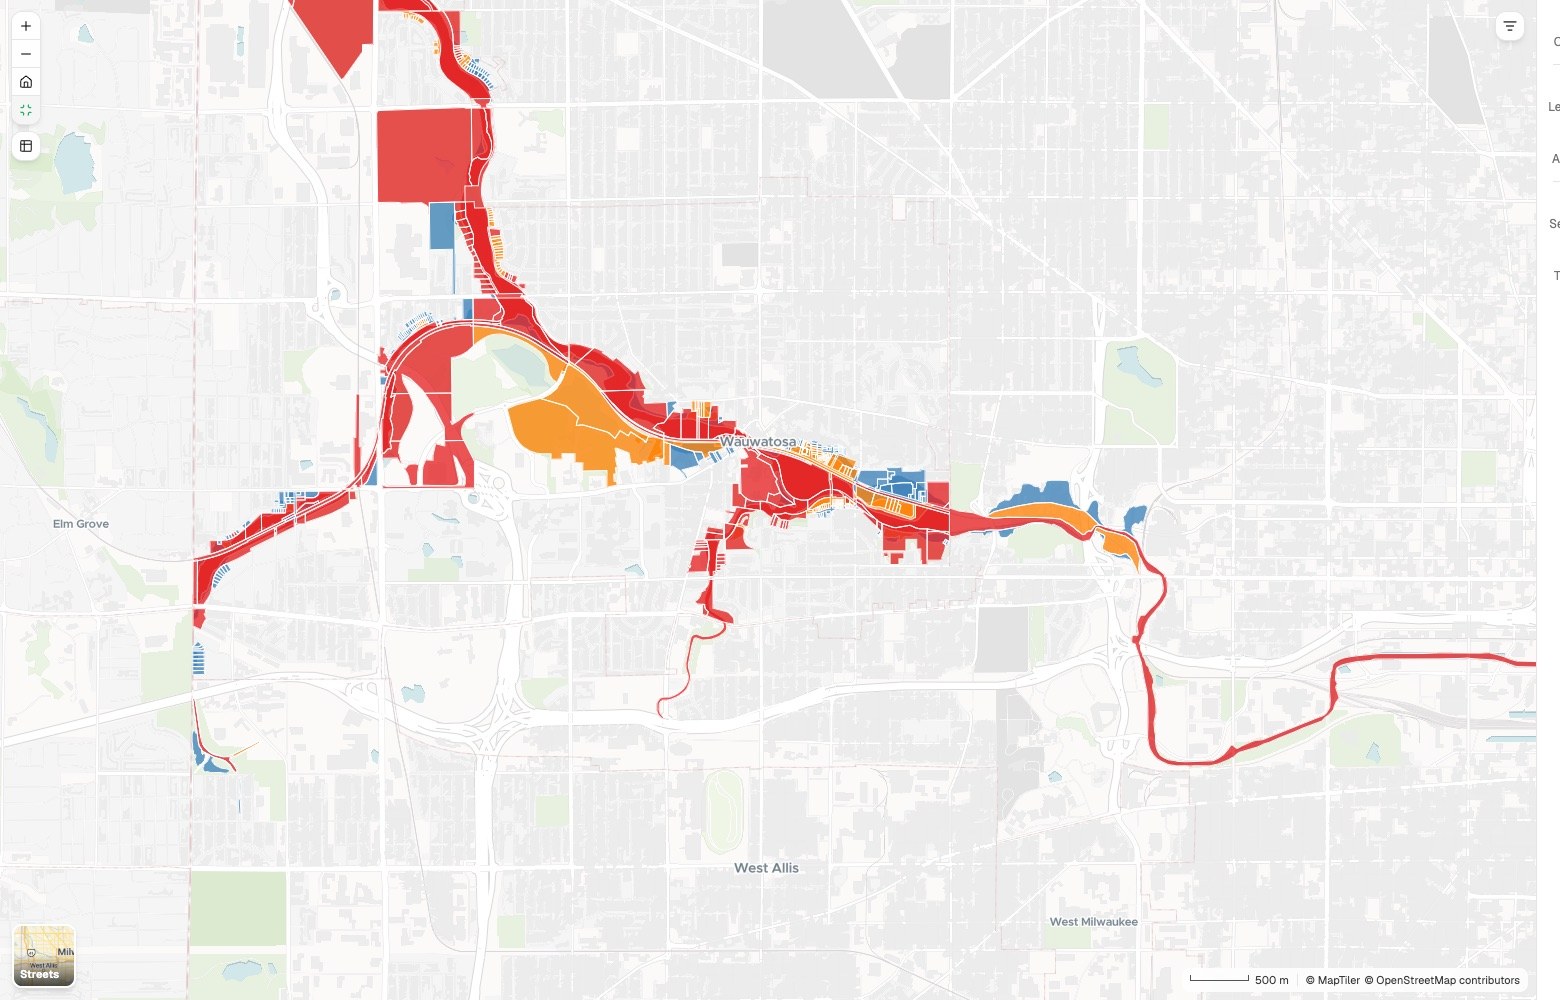
- Or ask
See everything you hold and everything you are chasing
Put a pipeline, an assemblage or a portfolio on one map from your own tracker, colored by stage or by date, with the totals worked out.
- Or ask
Which leases end in the next two years, and how much space is that?
Where does every parcel in the acquisition stand, by stage?
Land acquisition: parcels by deal stage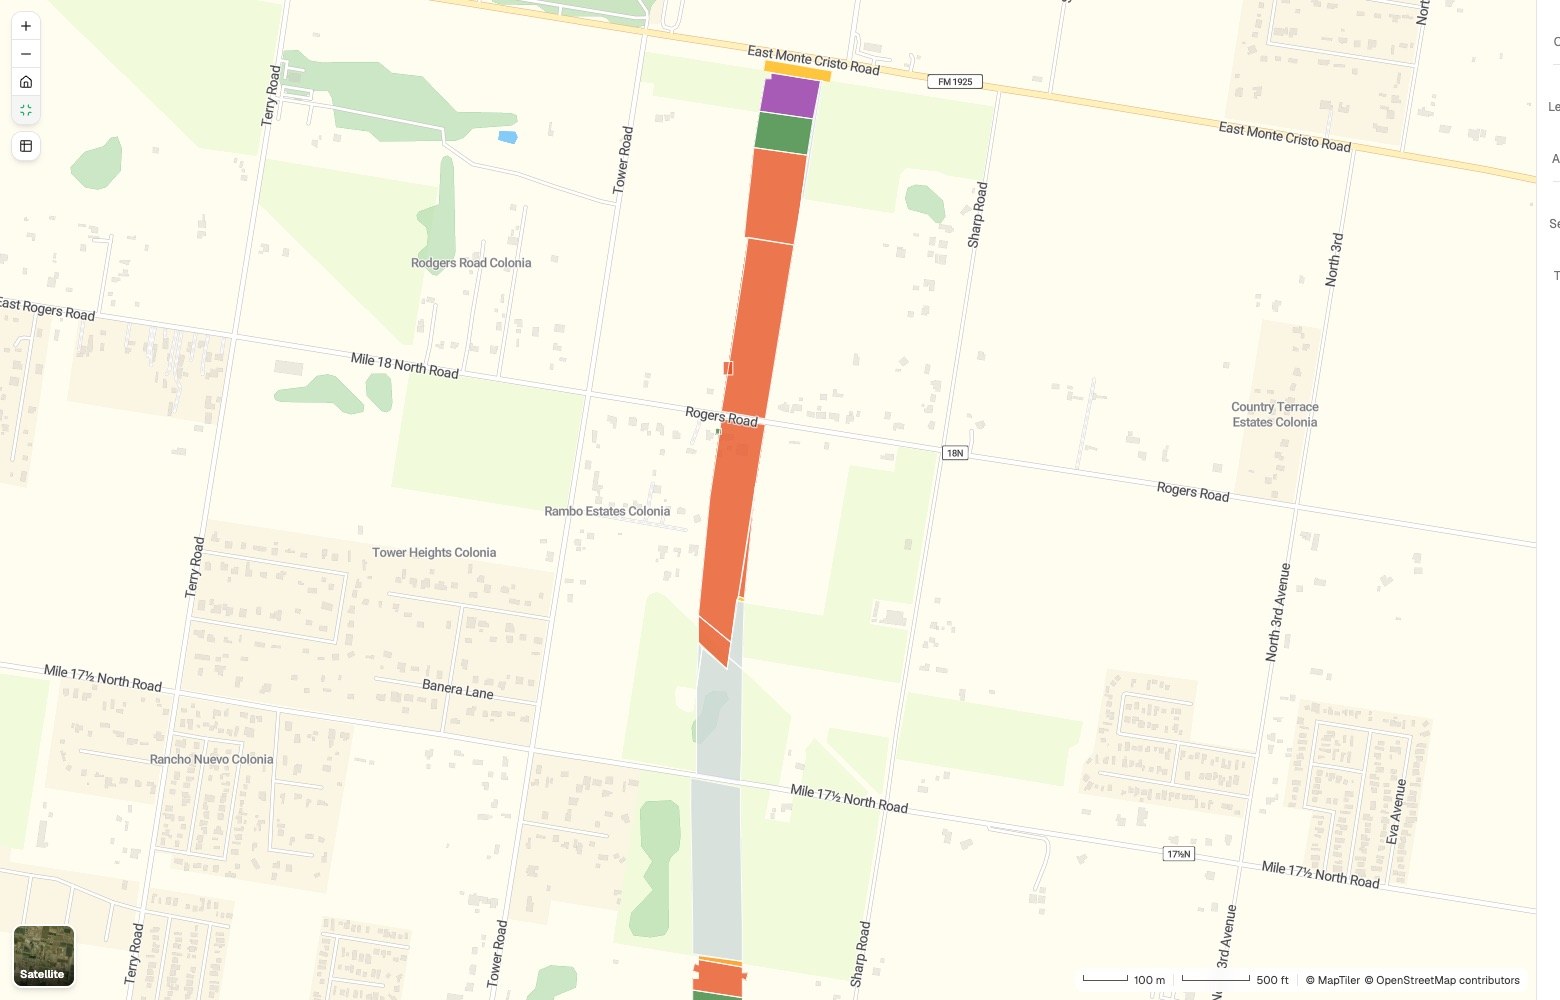
- Or ask
Hand over an exhibit that stands up
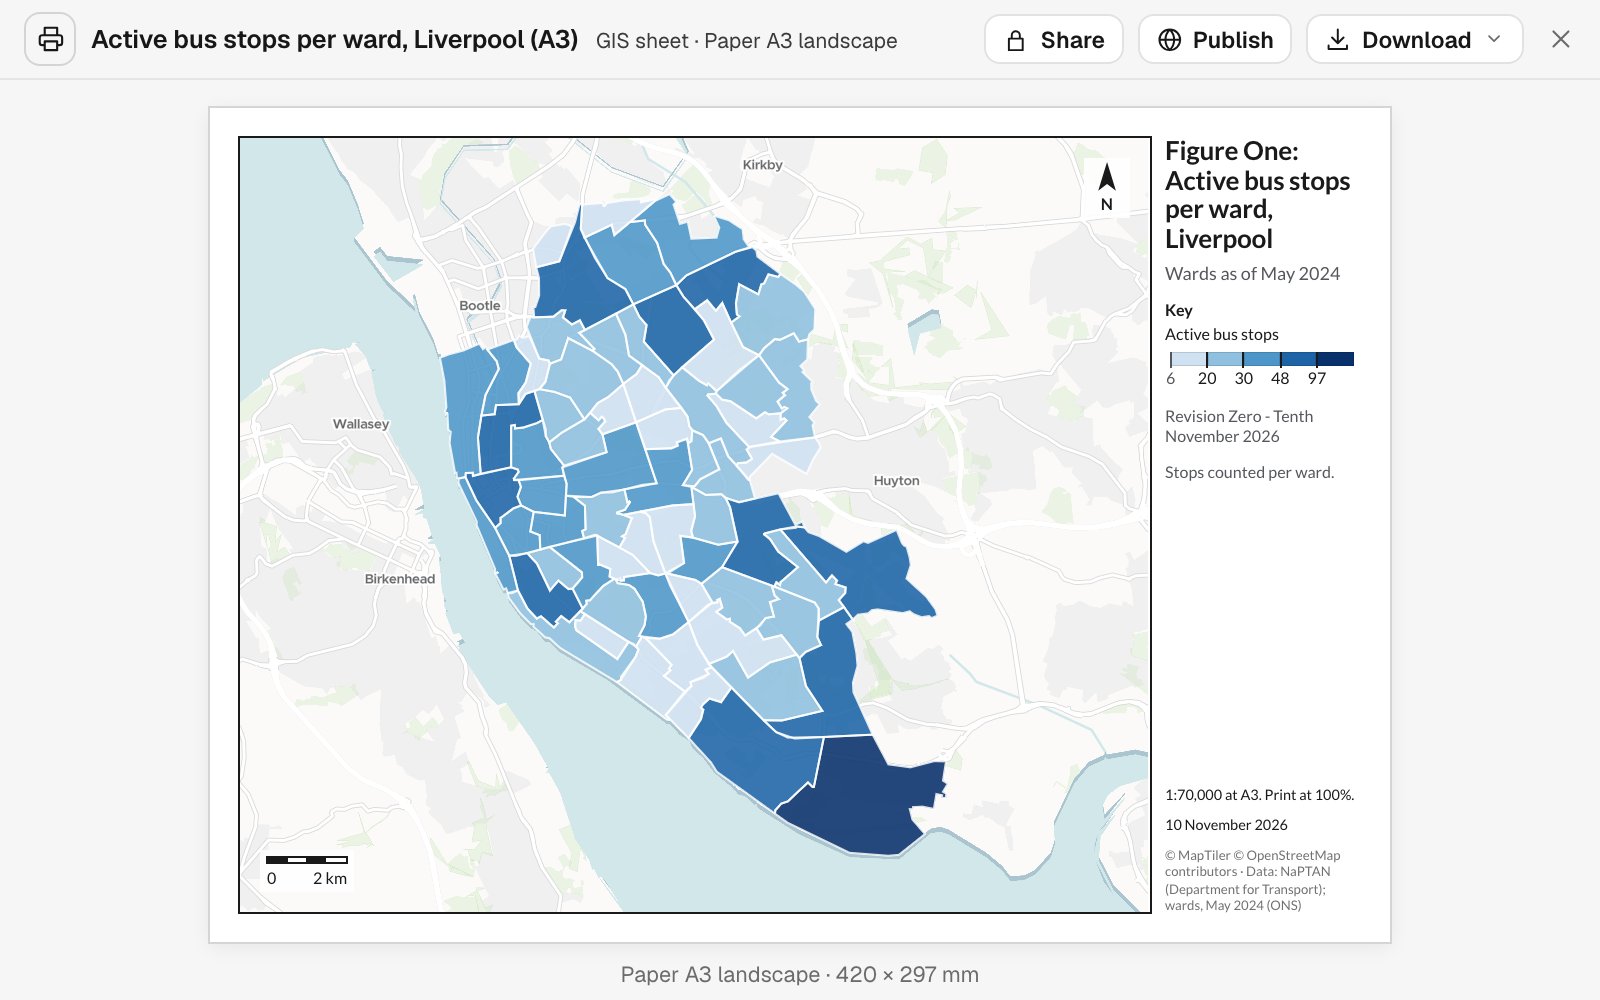
A print sheet to scale, a one-page summary, a written report or a map your client opens from a link. Each carries its sources, its dates and its method.
- Or ask
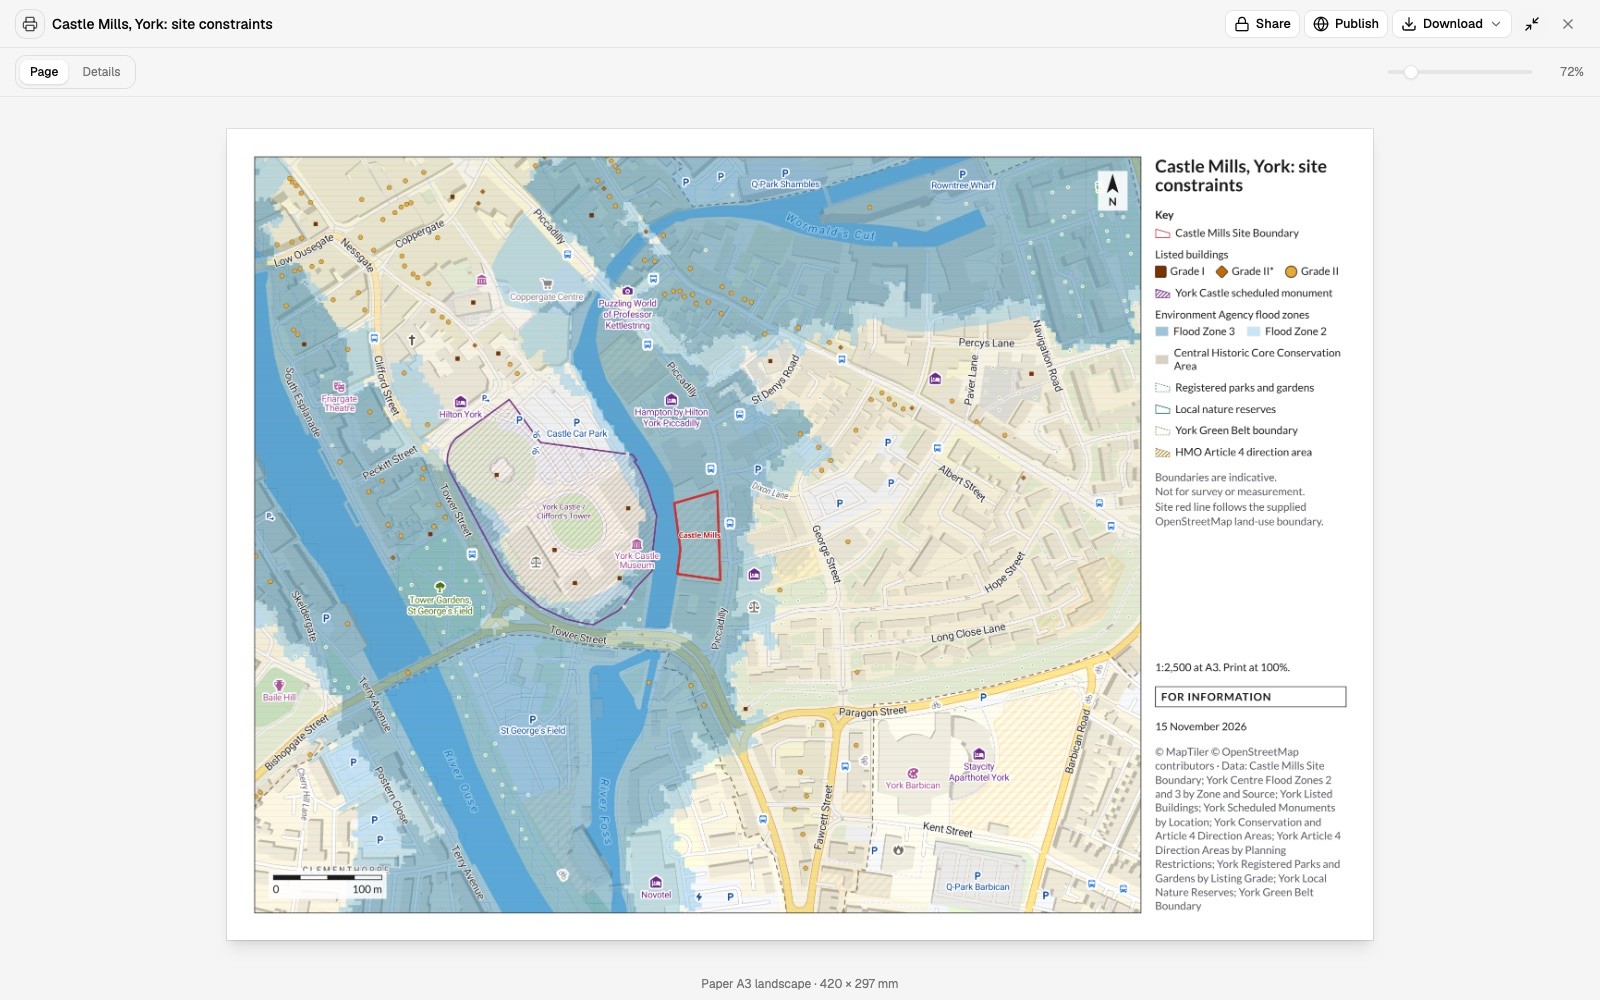
Make the constraints plan for the feasibility report.
Make this an exhibit for the investment committee memo.
- Or ask
Three examples
Three of many, from different corners of real estate. Each shows the request, what came back and who decides.
Where new homes are being permitted
A small developer of condo buildings, with no analyst on staff
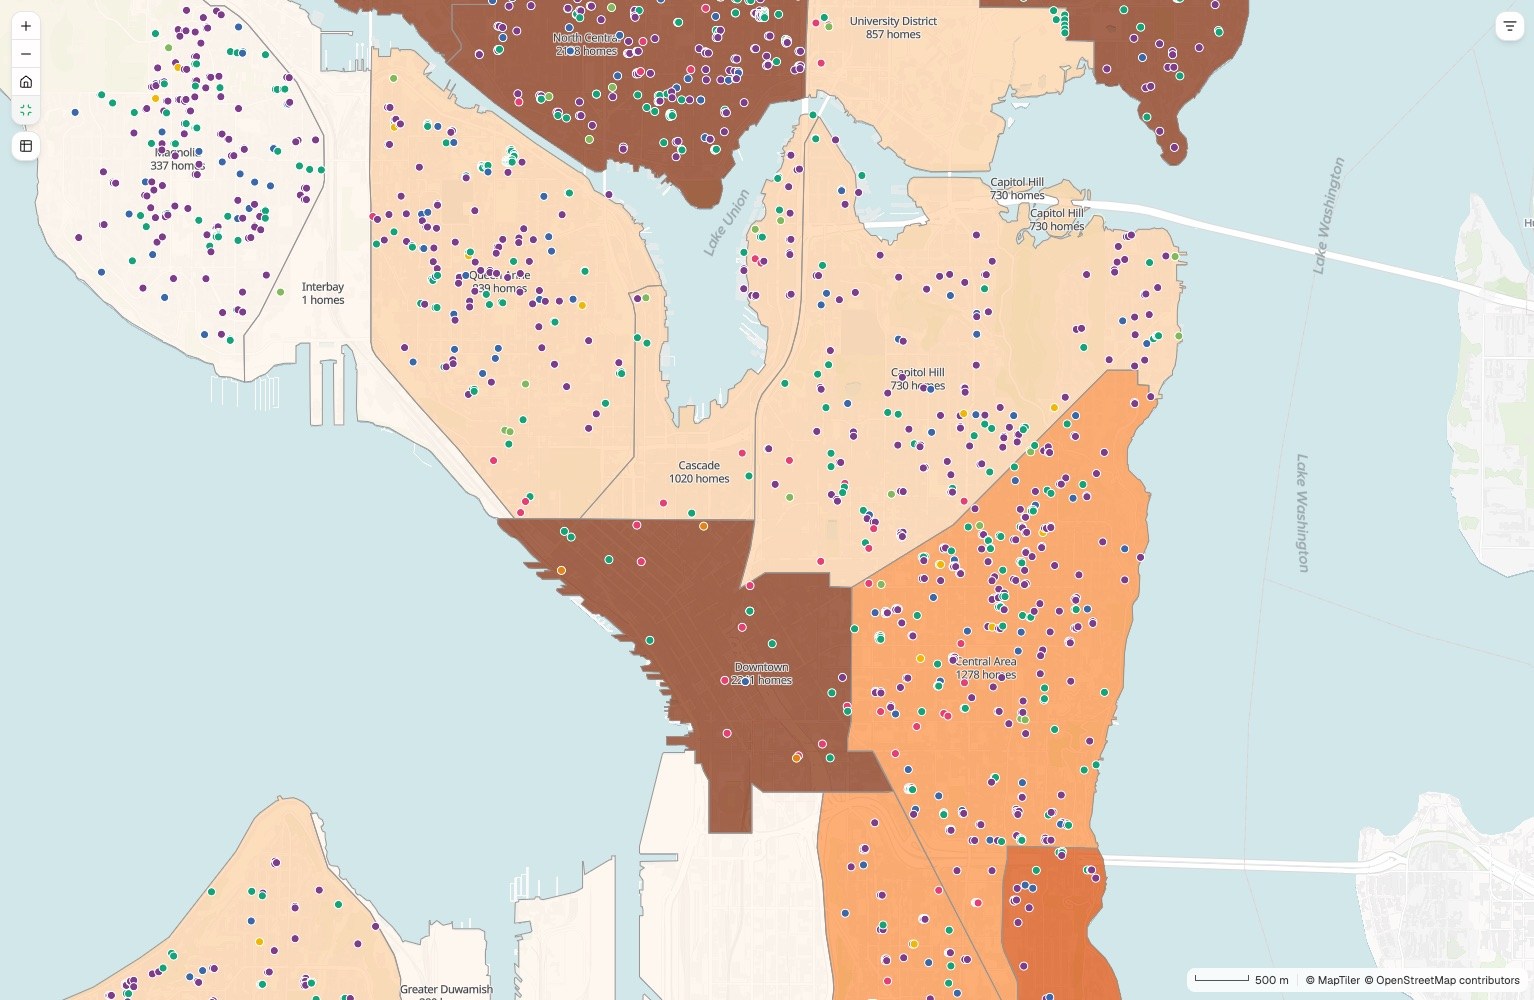
Districts
Net new homes, January 2023 to October 2026
- 2,188 and above
- 1,888 to 2,188
- 1,265 to 1,888
- 611 to 1,265
- Below 611
Dots are permits, colored by kind of housing.
The request
Attached are the city’s building permits since 2023 and its district boundaries. Count net new homes by district and year, and map every permit by kind of housing.
What came back
- Every district shaded by its net new homes
- Each permit as a point, colored by kind of housing
- The totals by district and year, with the key points written up
Goes toThe firm’s partners, when they choose where to look next.
Mapstack counts and maps the permits, while you pick the submarket and the site.
Who is within reach of a site, and who competes
A leasing broker, advising a veterinary group on a new location
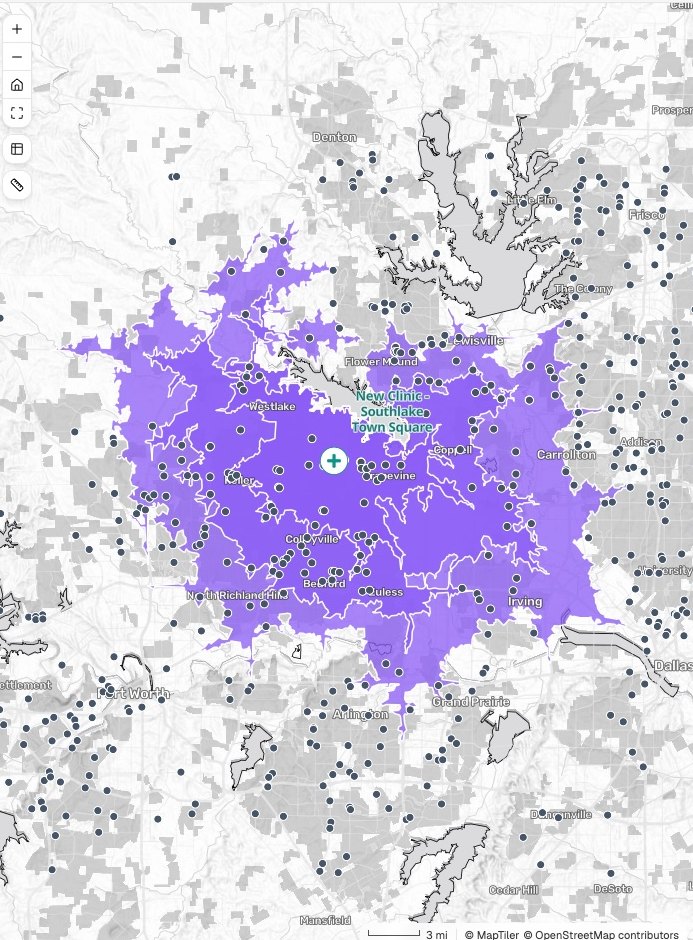
Southlake Town Square
Who is within a drive, and who competes
- The proposed clinic
- 10, 15 and 20-minute drives, nested
- Existing vet clinics
The request
Our client is a veterinary group considering Southlake Town Square. Show the 10, 15 and 20-minute drive areas, the households in each, and every existing clinic.
What came back
- The three drive-time areas on one map
- Households in each, from the census
- Existing clinics placed and counted, as a table for the pitch
Goes toThe broker, then the tenant, in the pitch.
Mapstack measures the reach, while the broker advises and the tenant signs the lease.
A year of sales, placed on the parcels
An appraiser working in a Connecticut harbor village
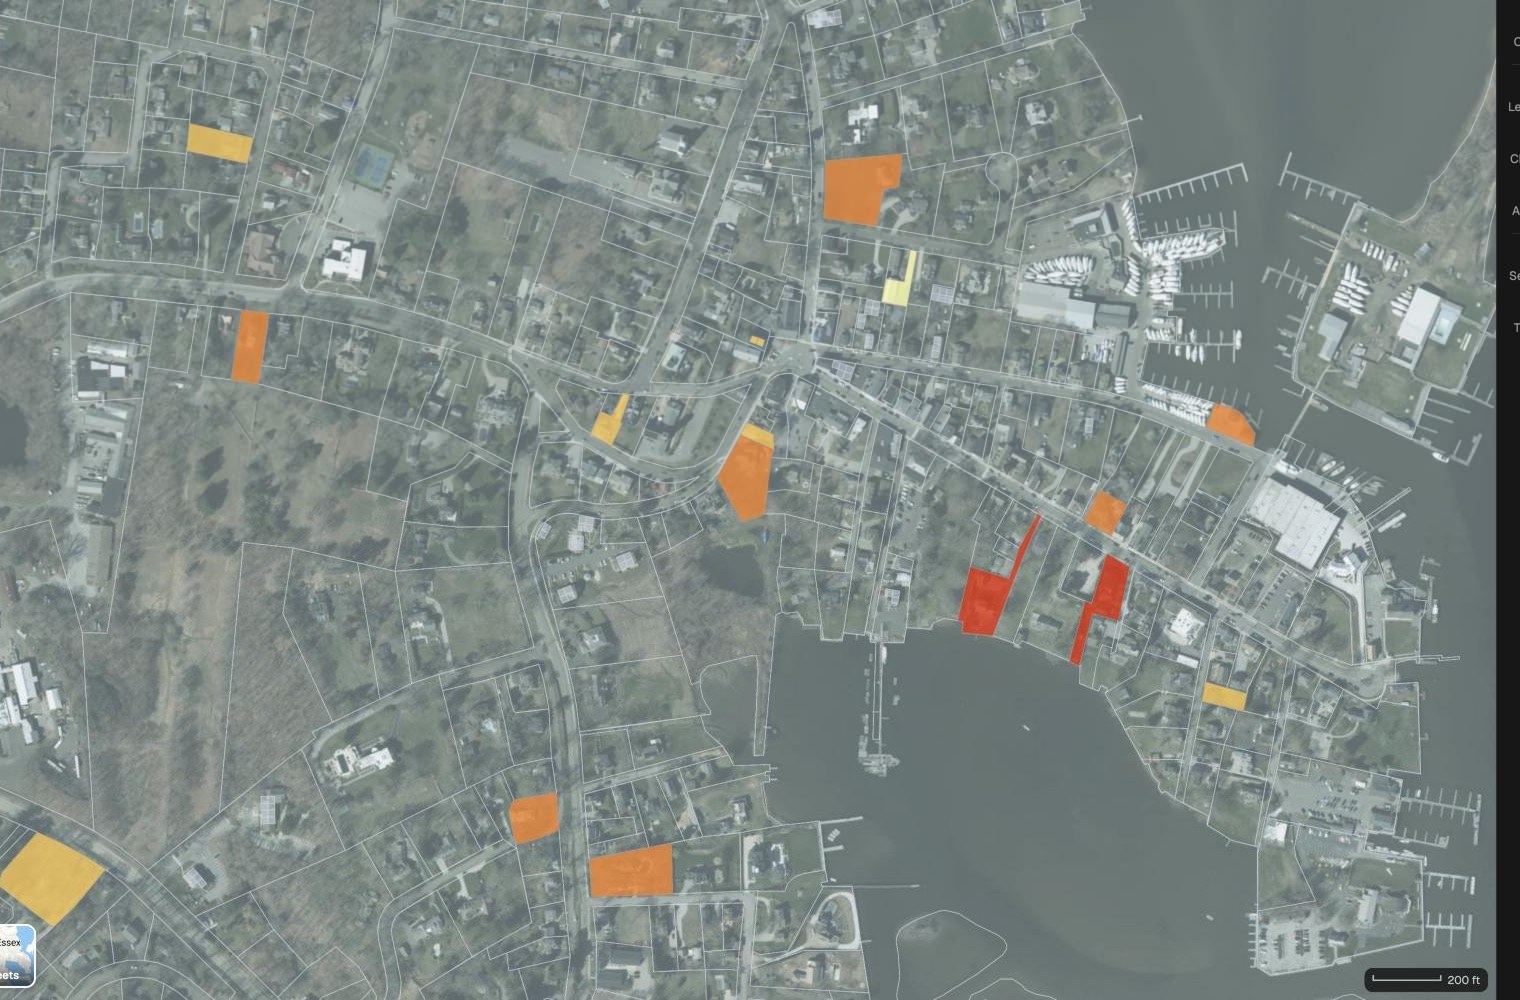
Sold parcels
Recorded sale price
- $3,600,000 to $8,350,000
- $1,200,000 to $3,600,000
- $575,000 to $1,200,000
- Below $575,000
The request
Attached are the parcels and the sales recorded in the last twelve months. Fill each sold parcel by its price over the aerial, and list the sales nearest the subject.
What came back
- Every sold parcel filled by price band, on the aerial
- The nearest sales with price, date and distance
- Their count, median and range
Goes toThe lender and the client, in the appraisal report.
Mapstack places and measures the sales, while the appraiser selects the comparables and gives the opinion of value.
An example of how it goes
Four asks in committee week. One analyst.
Priya is the analyst at a firm that buys, builds and holds commercial buildings. There is no GIS specialist: she builds the models and makes the maps. On Monday asset management, acquisitions, development and the principal each want something.
- property-register.xlsx
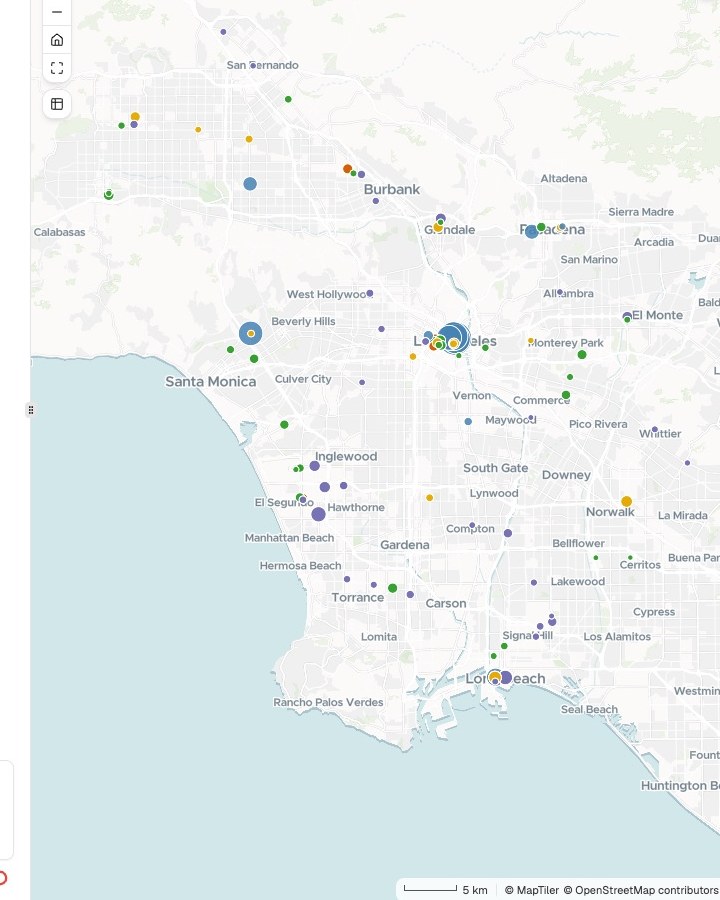
Map our buildings by when each lease ends, sized by rentable space, and total the space coming due by 2027.
Monday 9:10
Asset management asks first
One sentence and the property register. Priya hands it to Mapstack and goes back to her model.
- Portfolio: owned and leased, by lease expiration
Monday 9:25
The portfolio map is back
Every building by when its lease ends, with the space coming due totaled for the quarterly review.
- Parcels by FEMA flood zone
Which parcels in the riverfront deal touch a flood zone, and how much value is in each zone?
Monday 10:00
Acquisitions is next
A different question on different data, asked the same way. Development and the principal follow.
- Parcels by FEMA flood zoneBack with the people who asked
Four asks, four decisions
Each checked by Priya, with its sources
Monday 2:30
The decisions stay where they were
Hold or sell, the price, the site, the loan. Each goes back to the person whose call it is.
Priya spent the week on the underwriting.
She checked each result and passed it on. Four people got their evidence while their questions were still open, and the committee asked her about the numbers, which is her job.
Works with the data you already pay for
Your comps, your pipeline and your market data stay yours. Mapstack works from what you give it.
- What you bringAs it comes out of your tracker or your data provider.
- Comps and sales recordsYour pipeline or land logSite boundaries and parcelsProperty register and lease scheduleMarket data you license
- What Mapstack finds for youPublished data, fetched when you ask and named on the result.
- Census demographicsDrive and walk timesFlood and hazard zonesSchools, transit and other places
- What you hand onIn the form the reader expects.
- Location and site mapsPrint-ready exhibitsA one-page summaryA map the client can open
Your judgment, on the record
A committee, a lender or a client will ask what a figure rests on. So nothing here is taken on trust.

- Mapstack does not value, underwrite or pick. It gives no opinion of value and no recommendation on a deal. It supplies no comps, listings or market data: you bring those.
- No legal conclusions. On title, zoning entitlement or flood status it shows what the published map says, names the map and gives its date. It does not draw survey or title plans.
- Sources and dates on every result. Which flood map, which census, which of your files, and when each was current.
- The method is written out. How a distance was measured or a figure worked out comes back with the result, so you can review it and put your own name to the conclusion.
- Your data stays yours. Comps and deal terms stay in your workspace, and nothing reaches a client until you share it.
- It sits beside the systems you have. Your GIS, your tracker and your comp database stay the record. Mapstack reads your exports and hands data back.
The parts of Mapstack real estate teams use most
One teammate, whoever is asking.
Analysis
Who is within reach, what is nearby, what is exposed.
Reports and print maps
Exhibits and print sheets, to scale.
Data
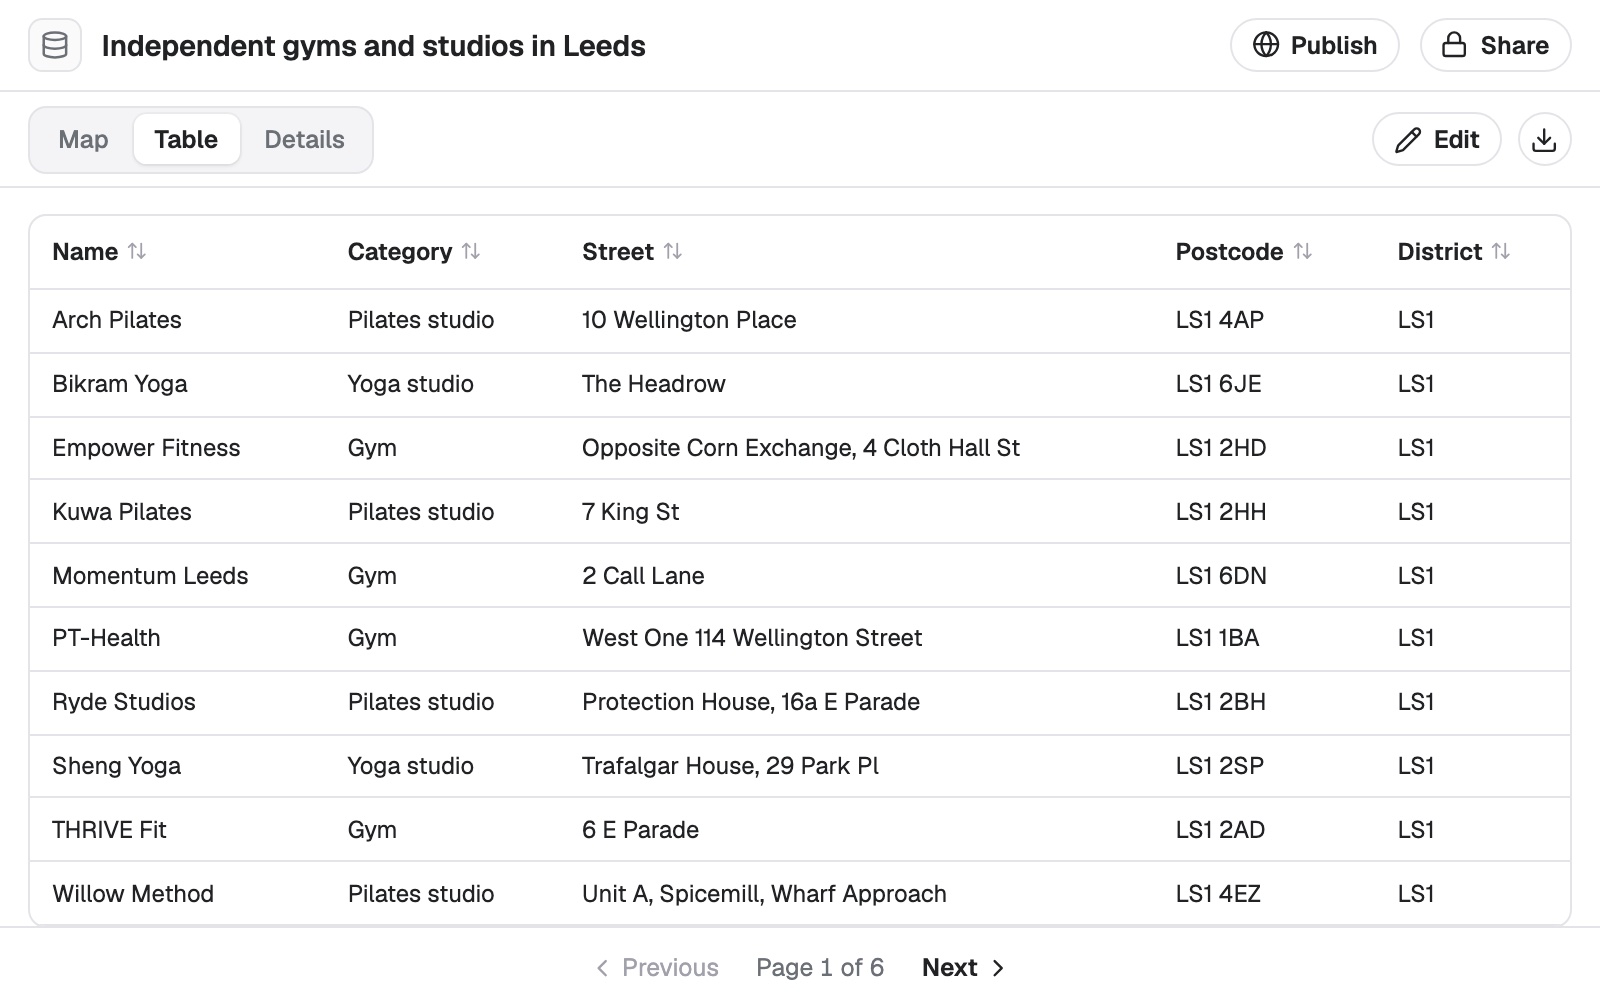
Sales, parcel and property lists cleaned and placed.
Sharing
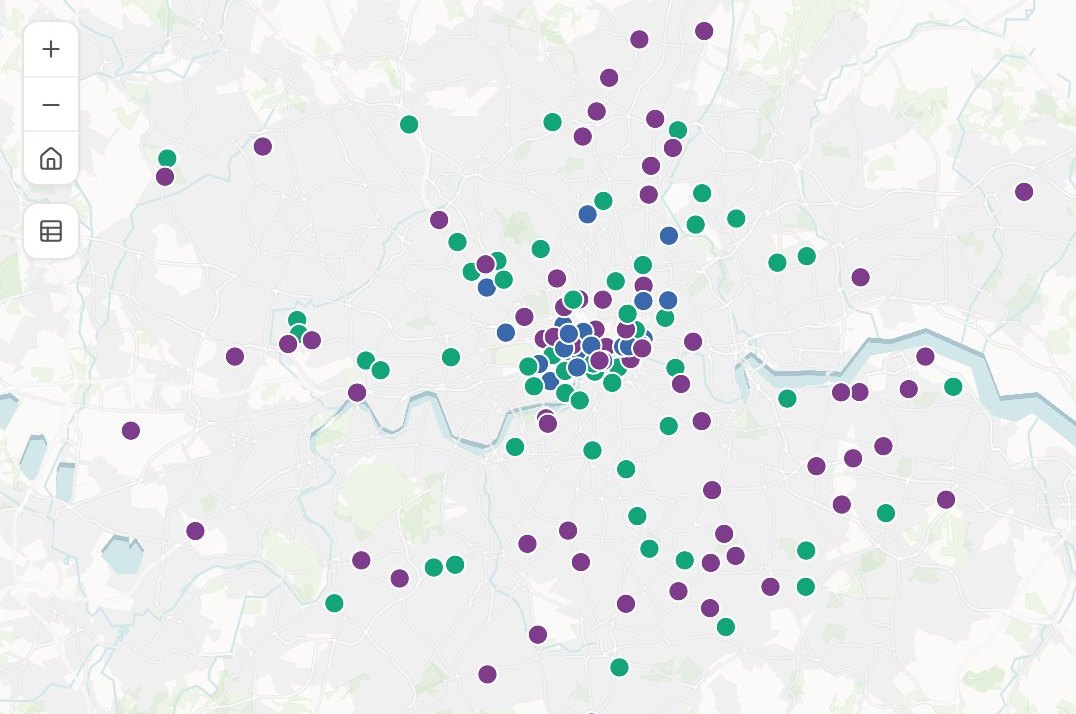
A map your client or committee can open.
Looking for a particular job? These go step by step.
- See who and what is within reach of a siteHouseholds and competitors in each drive time.
- Compare a shortlist of sites before you signYour candidate sites, set side by side on who lives around them.
- Score every tract by what people can walk toSeven kinds of everyday place, a 15-minute walk, a score for every tract.
- Track new homes district by district from building permitsPermits and net new homes by district and year, mapped and written up.
- Map the constraints on and around a siteWhat covers the red line, how far the rest are, and an A3 plan.
- Find which of your sites sit in a flood zoneEvery site flagged with the zone it is in.
- Add up the property value in each flood zoneParcels, homes and value per zone, each counted once in its worst zone.
- Track every parcel of a land acquisition on one mapEach parcel by deal stage, the acres signed and open, the offers ranked.
- Map every building you hold, and the leases coming dueOwned and leased on one map, by when each lease ends.
- Find the comparable sales for a valuationSales within your distance, their median and range, mapped by price.
- Put a site and its selling points on one pageA property infographic: the site, the stations and who lives nearby, on A4.
- Share a map privately with a clientA Viewer seat to open it, filter it and ask it questions, changing nothing.
What it costs
Mapstack is priced per person and free to start, with no minimum and no sales call.
Free
$0for one person
Ask about your own files. What comes back stays private to you until you choose to share it.
Creator
$16a person a month, billed yearly
Adds sharing with your team, reports and print sheets, and work that reruns without you.
Creator Max
$80a person a month, billed yearly
The same, with a larger monthly allowance for people who ask all day.
Colleagues who only need the answers take a Viewer seat at $10 a month. They open every result and ask it their own questions. See every plan.
Questions real estate teams ask
What GIS work can Mapstack do for a real estate team?
Most of what a deal, a site search or a portfolio review asks of a map-maker: maps, drive-time and demographic analysis, constraint checks, cleaned and placed lists, print sheets, one-page summaries and written reports. You ask in plain words or in GIS terms, and you check the result.
Is it only for GIS analysts?
No. It is for the analysts who make the maps and for the people who wait on one: anyone weighing a site, pricing a deal, pitching a client or running a portfolio.
Does Mapstack supply comps, listings or market data?
No. Bring the data you license or collect, as files. Mapstack adds published context: census demographics, drive times, flood and hazard zones, and places such as schools and transit.
Do we have to replace our GIS or our data subscriptions?
No. Mapstack reads the standard formats your GIS and your data providers export, and hands data back in formats they open. Your tracker and your comp database stay where they are.
Can a client open a map without an account?
Yes, once you publish it. A published map opens from a link with a search box and a legend, and you can make it private again at any time.
Can it make drive-time and demographic maps for a pitch?
Yes. Name the site and the minutes. Mapstack draws each drive-time area, counts the households in it from the census and places the competitors, as a map and a table.
How do I make the site maps for a land package or an IC memo?
Attach the site boundary and say what the package needs: a location map, the flood zones on the site, the sales or competing projects from your own list. Mapstack makes each exhibit with its sources, and makes them again when the terms change.
Can it screen a site for flood, wetlands and zoning?
Yes. Give it the boundary and the layers to check. It reports how much of the site each one covers, from published maps and anything you attach, and draws the plan. What that means for the deal is your call and your counsel’s.
Can it map a portfolio by lease expiration?
Yes. Attach your property register and lease schedule. Mapstack places every building, colors each lease by when it ends and totals the space coming due.
Can it map a subject property and its comparables for an appraisal?
Yes. Attach the subject and the sales you have. Mapstack places them, measures the distance to each and lists them by price and date. Selecting the comparables and the opinion of value remain the appraiser’s.
We work in the UK. Does it fit our professional standards on AI?
Each result comes with what was done and on which data, so the responsible surveyor can review it and record their own judgement. It can also draw a constraints plan for a site from the layers you name. Mapstack does not sign anything.
Is the data I upload private?
Yes, on every plan, Free included. Your files and everything made from them are private to your workspace by default. Nothing is public unless you choose to publish it, and you can make it private again.
What happens to my data?
It stays in your workspace and it stays yours. Only the people you give a seat to can see it. It is stored in the United States, it is not used to train AI, and when you delete it, it is removed.
Ask about the location you are weighing.
Free to start. No card.