
Water quality monitoring report
Turn river sampling results into a report.
Attach the published results for your sampling points. You get the points on a map and the quarterly report, with each point against your target and a chart for each.
Free to start. Reports on a paid seat.
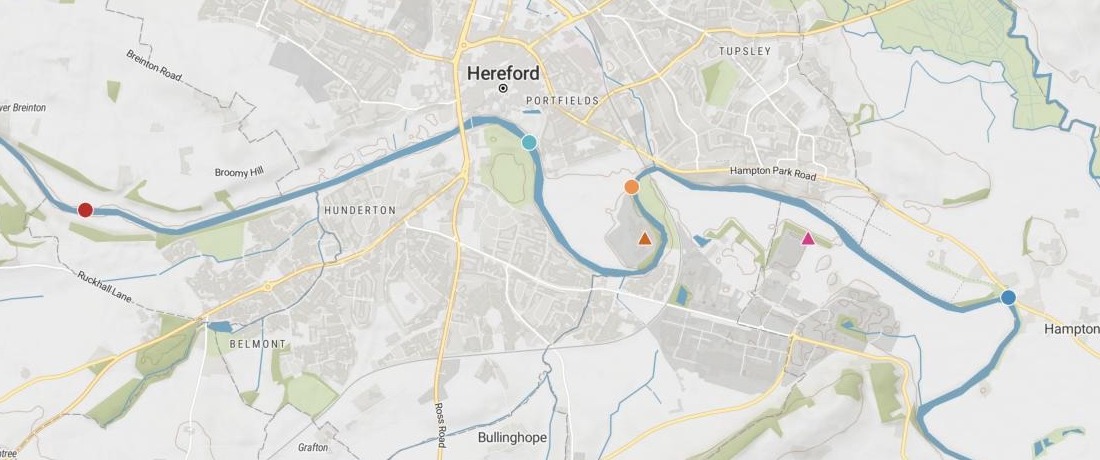
| The sampling points, west to east | |
|---|---|
| Broomy Hill | River, above |
| Victoria Bridge | River, above |
| Below Eign | River, below |
| Eign works | Effluent |
| Rotherwas works | Effluent |
| Carrots Pool | River, below |
Circles are the river points, triangles the works. The water quality report has a chart for each.
For whoever reports on a river
River trusts.Catchment partnerships.Angling and wildlife groups.The regulator publishes the samples.
Your trustees want to know if the river is getting better.
Comparing points above a sewage works with points below it is upstream and downstream monitoring: it shows whether the water changes as it passes the works.
Here you attach the published results. Mapstack maps the points and writes the report: the comparison, your target, the trend at each point, and the works themselves.
One real river
More ammonia below the works. Phosphate over the target above them.
The Environment Agency's published results for the River Wye at Hereford, January 2024 to October 2026: two points above the city's two sewage works, two below them, and the treated effluent from each works.
- Above the works too
- Bothupstream points went over the target, before the river reaches the works
- In the effluent
- Rotherwasammonia up to a mean of 5.2 mg/l in Q3 2026, from 2.6 in Q2
- Ammonia below the works
- 5–6×roughly, the mean at the points above them
| Orthophosphate samples over the target | Share | Samples |
|---|---|---|
| Broomy Hill, above the works | 16.0% | 4 of 25 |
| Victoria Bridge, above | 10.3% | 3 of 29 |
| Below Eign works | 23.8% | 5 of 21 |
| Carrots Pool, further below | 0.0% | 0 of 32 |
It keeps the river and the works apart.
The works are measured for total phosphorus, the river for orthophosphate. The report holds your target to the river alone, and says the effluent figures are concentrations, not loads or permit findings.
Environment Agency, Water Quality Archive: four points on the River Wye at Hereford and the final effluent of Eign and Rotherwas sewage works, January 2024 to October 2026, Open Government Licence. Run on 15 November 2026.
It opens with the answer your trustees asked for
A headline that answers the question and the key points, then a section and a chart for every sampling point.
- A headline that answers: is the river worse below the works, and for which measure.
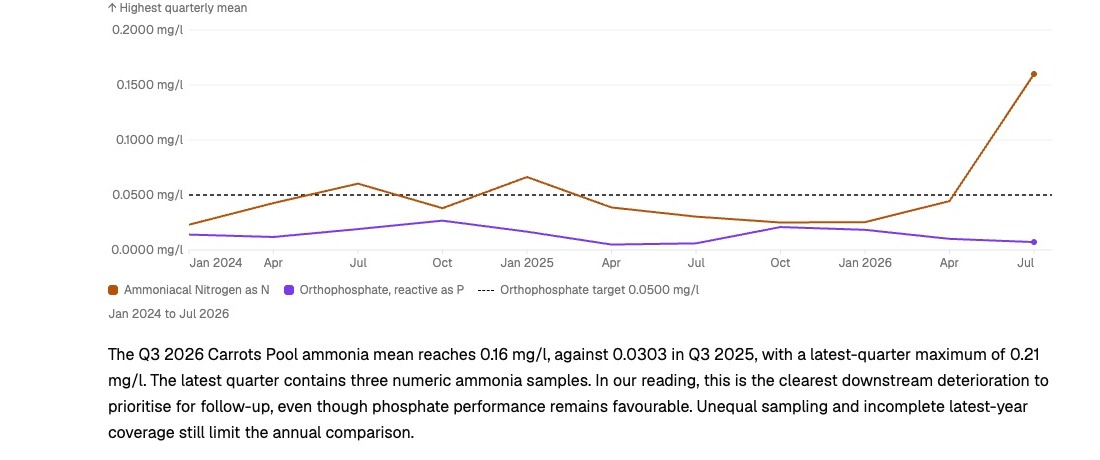
- Your target on every river chart, drawn as a dashed line.
- The trend at each point, by year and by quarter, in plain words.
- Ready for the board papers: share it, or download it as PDF, or as Word to edit.
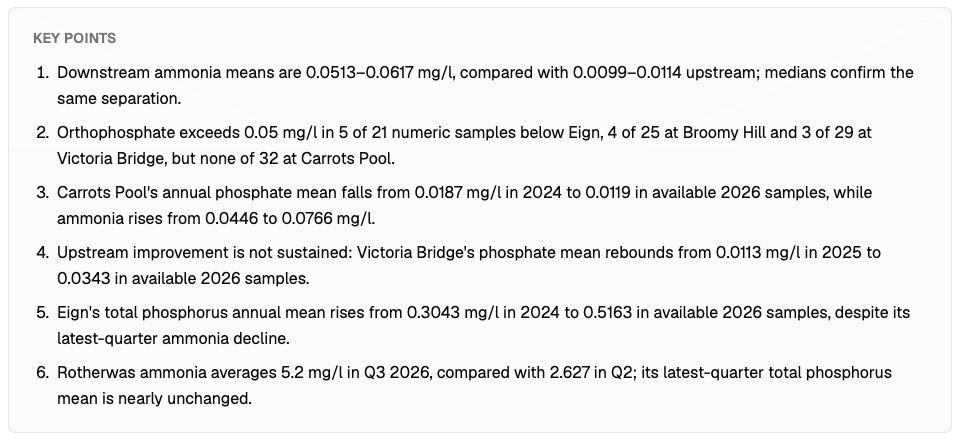
From the regulator’s download to the trustees’ report
Columns: Sampling point (its name), Point type (river or effluent), Position (longitude, latitude), Sampled (date and time), Measure (what was measured), Result (as published). 454 rows. Six points, nearly three years, one row for each result.
What you get
- A map of the sampling points, the river points and the works drawn apart.
- The quarter’s report, from the question to the conclusion.
- A line chart for every point, from your own results.
- The tables behind it: samples, means, medians and how many went over the target.
How it goes
You bring the results. Mapstack writes the report.
Attach the results and name your target.
Mapstack writes the report with a chart for every point.
You get what comes out of each works. Annual means in mg/l, 2024 to 2026 so far.
Common questions
What happens to our results?
It stays in your workspace. Only people with a seat in your workspace can see it. Nothing leaves unless you publish it yourself.
It is not used to train AI. Your data and your conversations are not used to train AI models.
It is still yours. You keep ownership of what you bring in. Delete it and it is removed.
The full answer is in the documentation: Your data, privacy and security.
What does it cost?
Free to start. One seat, for you, with a starter amount of work each month. No card.
The map of your sampling points is on the free seat. With your own files and public sharing.
The written report is on a paid seat. Paid seats are per person, and bring more work each month.
The prices are on the pricing page.
Does it say what the results cannot show?
Where the comparison is loose. Samples above and below were not taken together and came with no flows, so the report does not claim what each works adds.
What your target is not. It reads the samples against your target, and says that is not a formal regulatory compliance assessment.
Write yours.
Free to start. Reports on a paid seat.