
A site constraints map
See what is on and around your site, on one plan.
Attach your red line and the constraint layers you work with. You get one map with the site on top, what covers it, and an A3 constraints plan.
Free to start. Print-ready plans on a paid seat.
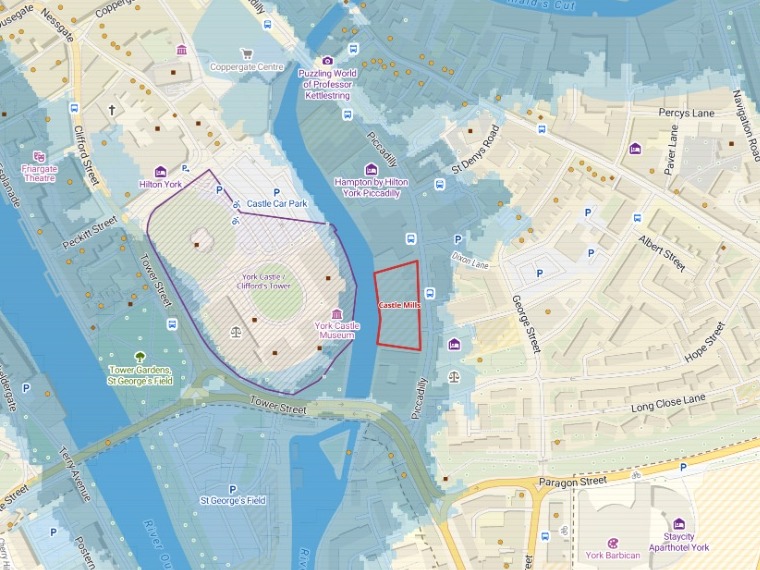
| On the plan | |
|---|---|
| Site boundary | 0.286 ha |
| Flood zone 3 | All of the site |
| Scheduled monument | 17.9 m away |
| Grade I listed | 10 within 250 m |
| Grade II* listed | 4 within 250 m |
| Grade II listed | 51 within 250 m |
From the A3 plan, drawn at 1:2,500 for the feasibility report.
For whoever is first on a site
Architects at feasibility.Planning consultants.Land and development teams.
Before anyone draws a building, someone has to know what the site sits in, and what sits around it.
Flood zones, listed buildings, monuments, conservation areas, the Green Belt: each comes from its own source, and the report needs them in one table and on one plan.
Here you bring the layers. Mapstack does the measuring and the drawing.
One real site
What covers the site, and how close the rest are
A brownfield site on York's register, beside the castle, with nine files attached in one message: the red line and eight constraint layers, each cut to about a kilometre around it.
- On the site
- 3designations cover it: flood zone 3, a conservation area and an Article 4 direction
- Within 100 m
- 7listed buildings, 3 of them grade I
- Named
- 10closest listed buildings, each with its grade and distance
| The nearest of each, from the red line | Distance |
|---|---|
| York Castle, a scheduled monument | 17.9 m |
| The Female Prison, grade I listed | 42.8 m |
| York Green Belt | 525.6 m |
| York Cemetery, a registered park | 526.9 m |
| St Nicholas Fields, a nature reserve | 785.1 m |
The castle is across the street.
York Castle and Clifford's Tower sit just over Tower Street from the site. Every distance is measured from the red line, and every nearest feature is named, so the table can go straight into the report.
Red line: OpenStreetMap. Flood zones: Environment Agency, Flood Map for Planning. Listed buildings, scheduled monuments, conservation areas, registered parks and gardens, local nature reserves, Article 4 direction areas and the Green Belt: the government's Planning Data platform. All downloaded and attached on 15 November 2026, and run the same day.
Ask how much of the site floods
Name the zones, and get the share of the site in each.
The figures come with what they mean for planning, in the words the report will use.
For flooding, how much of the site is in flood zone 3 and how much in zone 2?
All 2,861 m² of it is in zone 3, the higher risk; none is in zone 2 on its own. Mapstack added that housing is a "more vulnerable" use under national planning policy, so a site-specific flood risk assessment and the sequential and exception tests will be central to the scheme.
How it goes
You bring the red line and the layers. Mapstack measures from the boundary and draws the plan.
Attach the red line and your layers in one message.
Mapstack lays out the plan at A3, drawn at 1:2,500.
You get the closest, by name.
Common questions
What happens to our site files?
It stays in your workspace. Only people with a seat in your workspace can see it. Nothing leaves unless you publish it yourself.
It is not used to train AI. Your data and your conversations are not used to train AI models.
It is still yours. You keep ownership of what you bring in. Delete it and it is removed.
The full answer is in the documentation: Your data, privacy and security.
What does it cost?
Free to start. One seat, for you, with a starter amount of work each month. No card.
The map and the constraints table are on the free seat. With your own files and public sharing.
The A3 plan as a PDF or picture is on a paid seat. Paid seats are per person, and bring more work each month.
The prices are on the pricing page.
Where do the layers come from?
From you. Attach the red line and every layer the site needs, tree preservation orders and SSSIs included: the government’s Planning Data downloads, the Environment Agency’s flood map, your council’s own.
All in one message. Each file becomes its own layer on the map, with the site drawn on top.
Each constraint named. The table says what covers the site, and names the nearest of the rest.
Map your site.
Free to start. Print-ready plans on a paid seat.