
Site selection and catchment analysis
Compare your shortlist before you sign the lease.
Give Mapstack your candidate sites. You get the catchment of each, the people living in it and the competitors inside it, side by side.
Free to start. No card.
| Candidate | People | Bakeries |
|---|---|---|
| Ilford | 14,319 | 6 |
| Lewisham | 13,408 | 2 |
| Wood Street | 12,412 | 7 |
| Custom House | 10,557 | 1 |
| Canary Wharf | 5,829 | 8 |
Custom House: over 10,000 people within a short walk, and one bakery.
One real comparison
Five stations, a 10‑minute walk, one clear gap
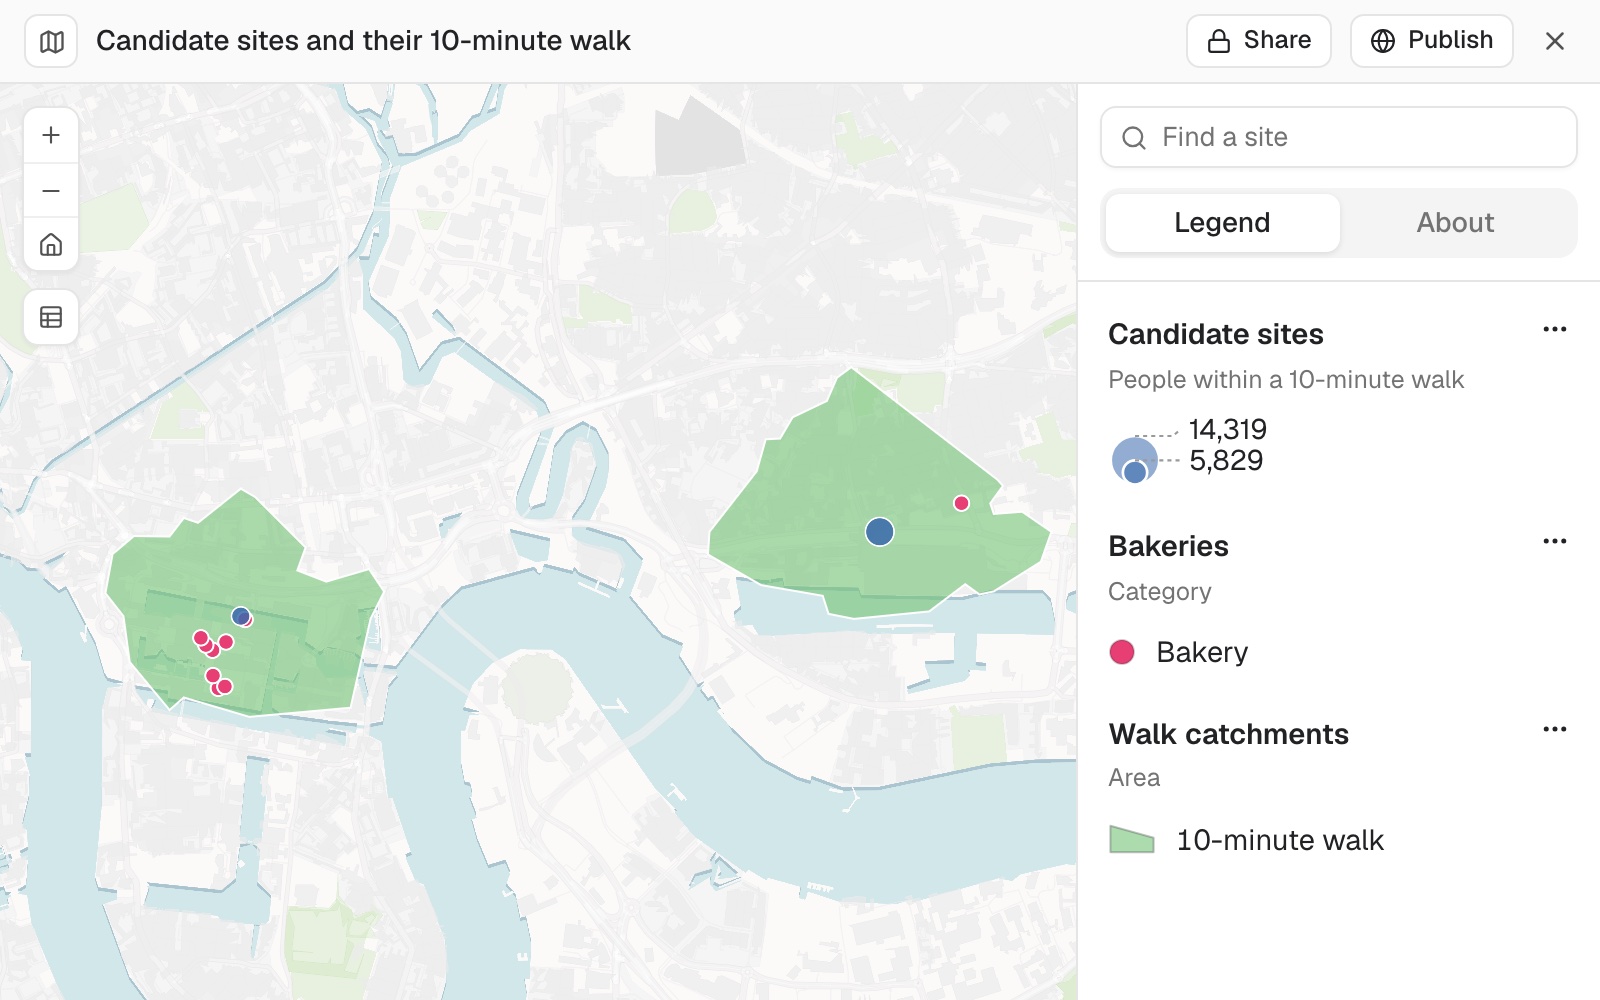
A kiosk chain with 149 sites at London stations is choosing its next one from five stations in east London. Its customers arrive on foot, and its competitors are bakeries.
- The shortlist
- 5candidate stations in east London
- The catchment
- 10 minon foot, along streets and paths people can use
- The competition
- 24bakeries across the five walks
| Candidate | People within a 10-minute walk | Bakeries inside |
|---|---|---|
| Ilford | 14,319 | 6 |
| Lewisham | 13,408 | 2 |
| Wood Street | 12,412 | 7 |
| Custom House | 10,557 | 1 |
| Canary Wharf | 5,829 | 8 |
Custom House stands out: over 10,000 people within a short walk, and one bakery.
Canary Wharf has the most bakeries and the fewest residents, because the people there in the day work there, and a count of residents does not see them. Mapstack gives you measured figures. The decision stays yours.
People: Census 2021 usual residents. Bakeries: Overture Maps open places data. The stations are real; the company is made up for the example. Figures from 10 November 2026.
For whoever has to pick
Every site on the shortlist looked good on the visit.
Someone still has to say which one, and why.
The usual answer is a consultant's report, or a hunch dressed up in a spreadsheet.
This gives you the same measured comparison for every candidate, and shows you what it counted.
How it goes
You say how your customers arrive and who you compete with. Mapstack does the measuring.
Attach your sites and your shortlist, and say how your customers arrive.
Mapstack draws each area and counts what is inside it.
You get the candidates side by side, as a table and a map.
The step-by-step guide is in the documentation: Work out where to open the next site.
One comparison is where it starts
Most shortlists begin with people and competitors. The same request stretches further. Each of these is something you can ask for today.
Change the measure
A different distance, a different way of getting there, a different rival.
- Count the people within a 5-minute walk as well, as a separate band.
- Use a 15-minute drive instead of a walk.
- Count gyms, not bakeries.
Bring your own evidence
Your existing sites and your customers say more than any average.
- Do the same for our existing sites, so I can compare the candidates with them.
- Which candidates have the most of our customers within a 10-minute drive?
Then make the case
The comparison is for someone: a board, a landlord, a bank.
- Put the five candidates on a map I can show the board.
- Keep the comparison as a dataset I can download.
- Which of these candidates sit in a flood zone?
Common questions
What happens to my site list?
It stays in your workspace. Only people with a seat in your workspace can see it. Nothing leaves unless you publish it yourself.
It is not used to train AI. Your data and your conversations are not used to train AI models.
It is still yours. You keep ownership of what you bring in. Delete it and it is removed.
The full answer is in the documentation: Your data, privacy and security.
What does it cost?
Free to start. One seat, for you, with a starter amount of work each month. No card.
This job is on the free seat. Maps, datasets, analysis, your own files and public sharing are all included.
Pay per person for more. A paid seat brings more work each month, and seats for your team.
The prices are on the pricing page.
Where do the numbers come from?
Travel time. Measured along the streets and paths people can use: on foot, by bike or by car. Mapping people call these areas isochrones, or drive-time maps.
People. Published census figures, counted by the share of each census area that falls inside.
Competitors. Open data on places, each with a confidence, and likely duplicates flagged.
Compare yours.
Free to start. No card.