
Location-allocation: choose the best sites
Choose the few sites that reach the most people.
Attach your list of sites and say who they must reach. You get the set of sites that reaches the most people, what each one covers, and a map.
Free to start. Printable maps on a paid seat.
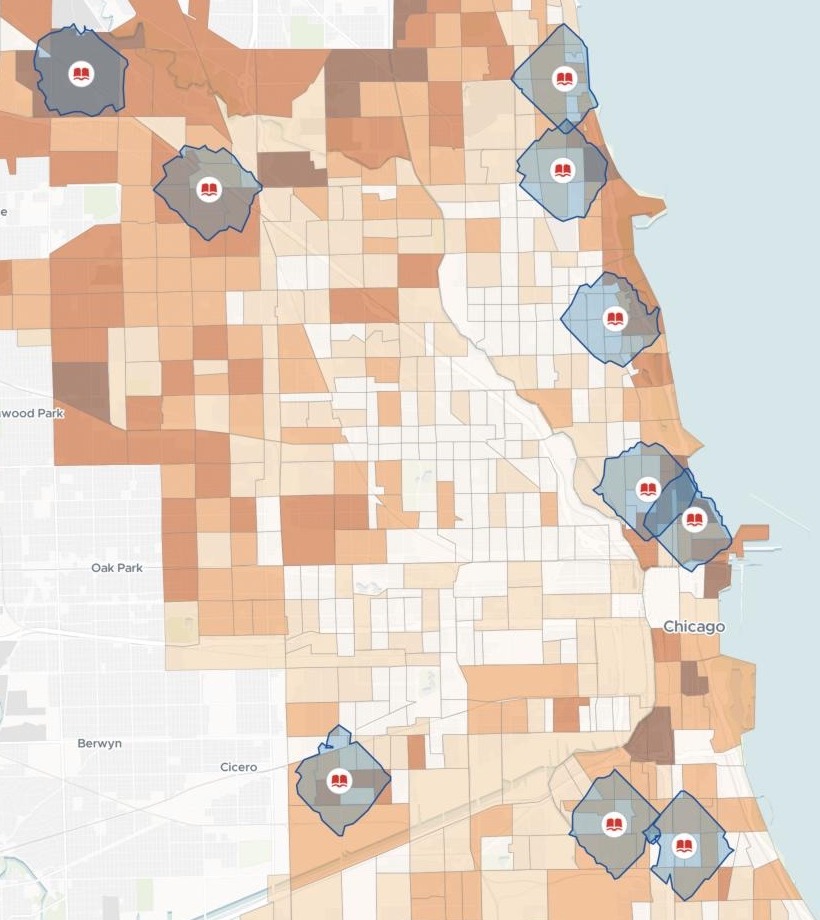
| On the map | |
|---|---|
| Branches chosen | 10 |
| Within their 15-minute walks | 48,717 aged 65+ |
| Residents 65+ in a tract, darkest shade | 1,271+ |
That is 13% of the city's 368,920 residents aged 65 and over.
For whoever decides which sites get the money
Cooling centres for a heat wave.Extended hours.A budget for some of your sites, not all.
Which set reaches the most people?
Taking the busiest sites one by one does not give you that set: two sites close together reach the same people. Picking the set that does is called location-allocation.
Here you ask it in a sentence, with your list attached.
One real city
Ten libraries to keep older residents cool
The Chicago Public Library's list of its branches, attached, and the latest American Community Survey count of people aged 65 and over, which Mapstack fetched for every census tract in the city.
- Candidates
- 82branches on the city's list
- Demand
- 793census tracts, each with its count of residents 65 and over
- Chosen
- 10branches: the set that, together, reaches the most older residents
| Branch | Residents 65+ within a 15-minute walk |
|---|---|
| Water Works | 7,280 |
| Near North | 6,521 |
| Edgewater | 5,644 |
| Toman | 5,252 |
| Bezazian | 4,942 |
| Jefferson Park | 4,314 |
| Merlo | 4,241 |
| Chicago Bee | 3,591 |
| Roden | 3,528 |
| Daley, Richard J. | 3,404 |
Some walk areas overlap, on the north side most of all.
Where they do, the older residents who live there are shared between the branches that reach them.
Branches: City of Chicago Data Portal, Libraries: Locations, Contact Information, and Usual Hours of Service. Residents 65 and over: US Census Bureau, American Community Survey 2023 5-year estimates, by census tract. Run on 14 November 2026.
How it goes
You bring the list of sites. Mapstack brings the people and the streets.
Attach your sites and say who they must reach.
Mapstack picks the set and maps it.
You get each branch with the older residents it covers.
The choice is where it starts
The same request stretches further. Each of these is something you can ask for today.
See who is left out
The gaps are the next question.
- Show me the neighbourhoods with the most older residents outside a 15-minute walk of the 10.
Change the question
Another limit, another goal.
- Use a 10-minute walk.
- How few branches would put half our older residents within a 15-minute walk?
Hand it on
For the people who sign off the budget.
- Make a printable map of the coverage.
Common questions
What happens to our site list?
It stays in your workspace. Only people with a seat in your workspace can see it. Nothing leaves unless you publish it yourself.
It is not used to train AI. Your data and your conversations are not used to train AI models.
It is still yours. You keep ownership of what you bring in. Delete it and it is removed.
The full answer is in the documentation: Your data, privacy and security.
What does it cost?
Free to start. One seat, for you, with a starter amount of work each month. No card.
The choice, the counts and the map are on the free seat. With your own files and public sharing.
A printable map is on a paid seat. Paid seats are per person, and bring more work each month.
The prices are on the pricing page.
How does it choose?
The walk follows the streets. Each walk area is drawn along the street network, not as a circle. Mapping people call these isochrones.
Every site opens up. Click a branch for its address, hours and the older residents it covers. A chart beside the map ranks them.
It asks before a big job. A large routing job shows the share of your allowance it will use, and waits for your go-ahead.
Choose yours.
Free to start. Printable maps on a paid seat.