
Sea level rise and critical facilities
See which facilities a future flood reaches.
Name the sea level rise flood your city publishes and attach your schools, hospitals and fire stations. You get every one inside the flood by name, and a map.
Free to start. Reports and prints on a paid seat.
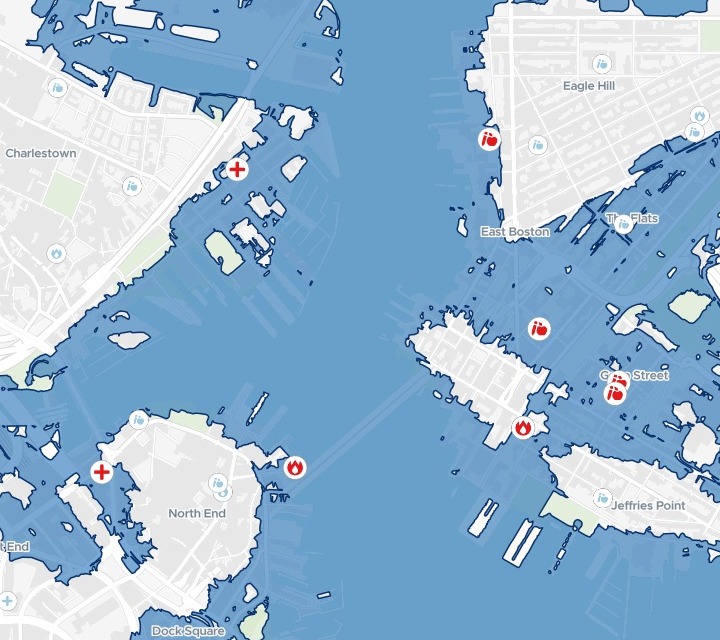
| On the map | |
|---|---|
| Flood with 21 inches of sea level rise | |
| Facility inside the flood | |
| Facility outside, shown faintly |
Five of the eight facilities inside are in East Boston.
For climate resilience and capital planning
The city has mapped where the water will reach.The schools, hospitals and fire stations are in three spreadsheets.
The briefing needs their names.
A 1% annual chance flood has a one in a hundred chance of happening in any year: the 100-year flood. Its flood extent is the area the water covers, and climate plans map it with the sea level rise expected in the decades ahead.
For capital planning, the question is which of the critical facilities a city relies on sit inside it, and where.
One real city
Boston’s facilities, checked against the 2050s flood
The City of Boston's lists of public school buildings, hospitals and fire department locations, against Climate Ready Boston's 1% annual chance coastal flood with 21 inches of sea level rise. Mapstack found that flood layer on Analyze Boston, the city's open data portal, and fetched it itself.
- Hospitals inside
- 2MGH at the Navy Yard, and the VA on Causeway Street
- Fire sites inside
- 2Engine Co. 9 on Sumner Street, and a department site at 50 Battery Wharf
- Inside the flood
- 8of 197 schools, hospitals and fire locations, each named with its address
- Inside the flood
- 8
- Outside
- 189
The schools, by name.
Alighieri Montessori and East Boston EEC on Gove Street, McKay K-8 on Cottage Street, and Umana / Alighieri K-8 on Border Street.
City of Boston, Analyze Boston: Climate Ready Boston 2050s 1% annual chance coastal flood extent with 21 inches of sea level rise; public school buildings, 2018–19; hospitals; fire department locations. Run on 15 November 2026.
How it goes
Attach your lists and name the published flood.
Mapstack checks every facility against the flood and maps them.
Every facility gets a flood status.
Go further
The same check, on another flood or another list.
Another scenario
Name the next flood the city publishes and compare.
- Do the same with the city's flood extent for 36 inches of sea level rise, and tell me which facilities are inside that one but not the 21-inch flood.
Another list
Attach it and check it against the same flood.
- Attached are our libraries and community centres. Tell me which are inside the same flooded area, by name, and add them to the map.
Common questions
What happens to our facility lists?
It stays in your workspace. Only people with a seat in your workspace can see it. Nothing leaves unless you publish it yourself.
It is not used to train AI. Your data and your conversations are not used to train AI models.
It is still yours. You keep ownership of what you bring in. Delete it and it is removed.
The full answer is in the documentation: Your data, privacy and security.
What does it cost?
Free to start. One seat, for you, with a starter amount of work each month. No card.
The facility check and the map are on the free seat. With your own files and public sharing.
A written report or a static map graphic is on a paid seat. Paid seats are per person, and bring more work each month.
The prices are on the pricing page.
What do I attach?
Your facility lists. Spreadsheets with each one’s name and where it is.
Not the flood. Name the scenario as your city publishes it on its open data portal, and Mapstack finds it and loads it.
Check yours.
Free to start. Reports and prints on a paid seat.