
Mapstack Maps
The AI map maker for GIS work.
Describe the map you need. Mapstack brings in the data, builds it and hands it back.
Free to start. No card.
Watch a map get made
A site list goes in. A finished map comes back. One request, start to finish.
Multiply the impact of your GIS expertise.
Your AI teammate takes on the map
From one sentence to a finished map, handed back for your review.
Say what it is for, not how
Name who will read the map and what they need to see. Mapstack works out the styling, the classes and the tools to match, so you skip the set-up.
Finished, not first draft
The legend, the popups, the search box, the filters and the sources arrive done. You review a finished map, not a draft to tidy.
Mapstack brings the data
Use your own files, or let Mapstack find what is missing. It is connected to public datasets from around the world and can search the web for more, so you stop hunting for data.
Change it by asking
Say what should change. That changes and everything else stays, so a revision takes a sentence, not a rebuild.
Live the moment it exists
Every map has its own link from the start. Share it with your team, or publish it when you choose. Nothing to host.
Your maps stay current
Fix the data and the map follows. Put it on a schedule and it updates itself, so you never rebuild last month’s map.
Every map is built for the people who use it
No template and no one-size-fits-all viewer. Mapstack designs each map around its readers: what they will search for, what they will filter by, and what they need to see when they click.
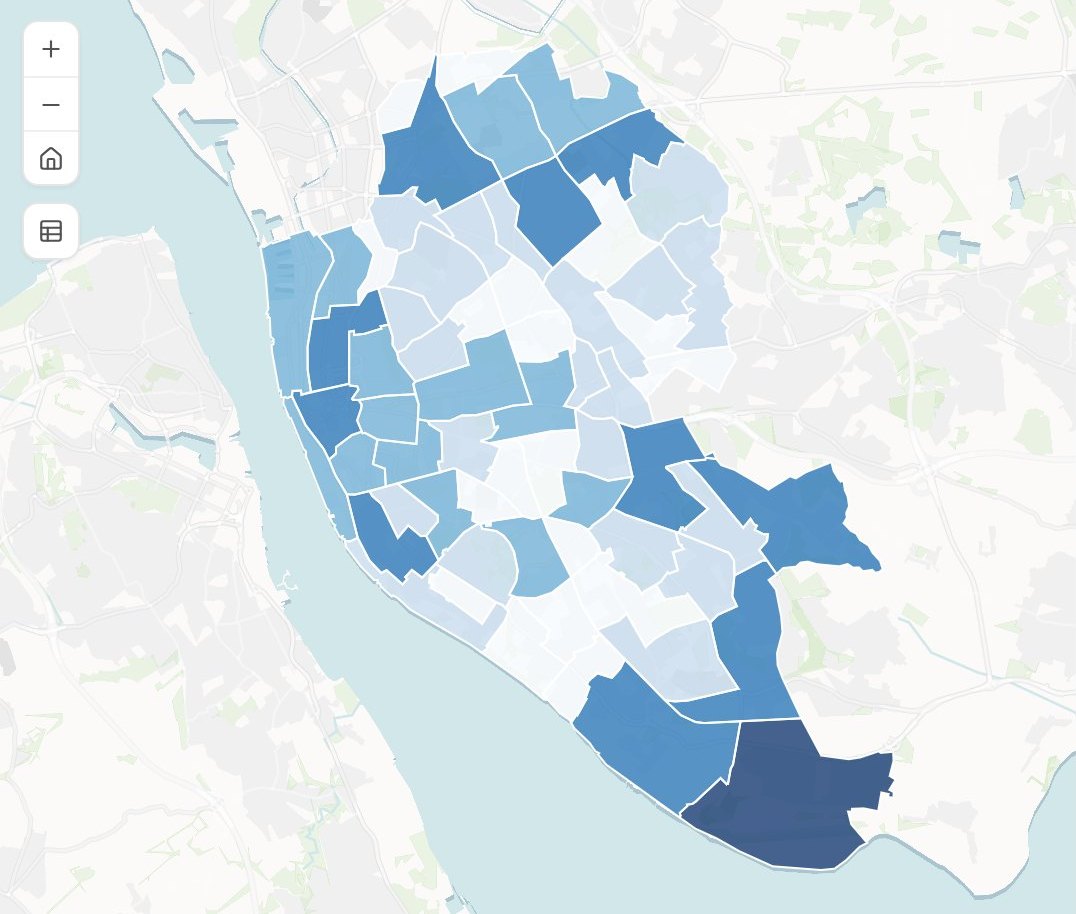
Chargers per 1,000 households
Households with a car
- 4.1 and above
- 2.9 – 4.1
- 1.8 – 2.9
- 0.9 – 1.8
- Below 0.9
Districts in each class
- 4.1+6
- 2.9 – 4.111
- 1.8 – 2.917
- 0.9 – 1.819
- Below 0.911
- Search. Readers find their own place by name.
- A legend that explains itself. It says how to read the map, and switches each class on and off.
- A chart beside the map. How the values are spread, linked to what is on screen.
- Sources, on the map. What it shows and where the data came from, written for its readers.
- A link from the start. Share it with your team, or publish it for anyone.
Ask for the map you need
Four requests, as someone would type them, and what came back.
See where the demand stacks up
Sunward, a home-solar installer choosing its next markets
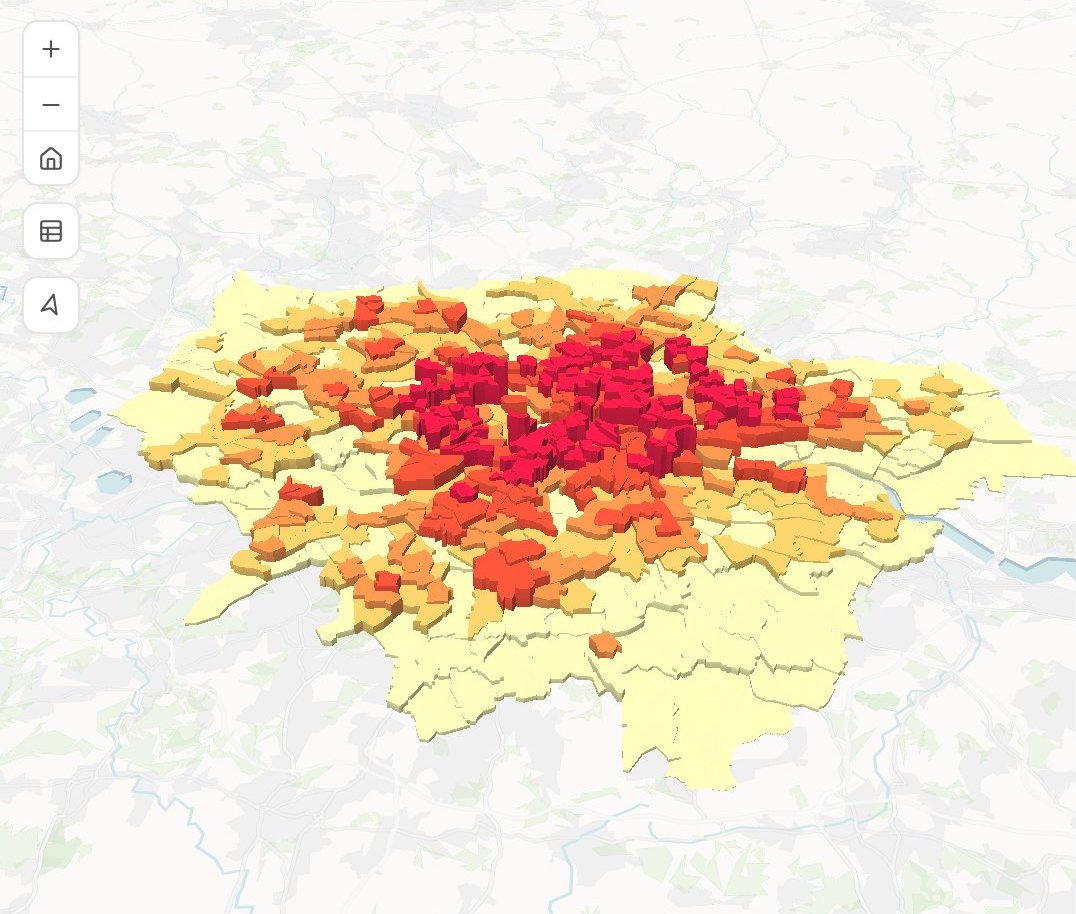
Homes not yet reached
Share of owner-occupied homes
- 92% and above
- 84% – 92%
- 75% – 84%
- 63% – 75%
- Below 63%
Height shows the number of homes
The request
Attached is our list of installs. For every district in the region, find the number of owner-occupied homes and work out the share we have not reached yet. Shade the districts by that share and raise each one in 3D by the number of homes, so the big untapped districts stand tall.
What came back
- Housing figures found and joined to every district
- Colour for the share still to reach, height for the number of homes
- A legend that explains both
Show where the rides bunch up
Loop, a city bike-share operator
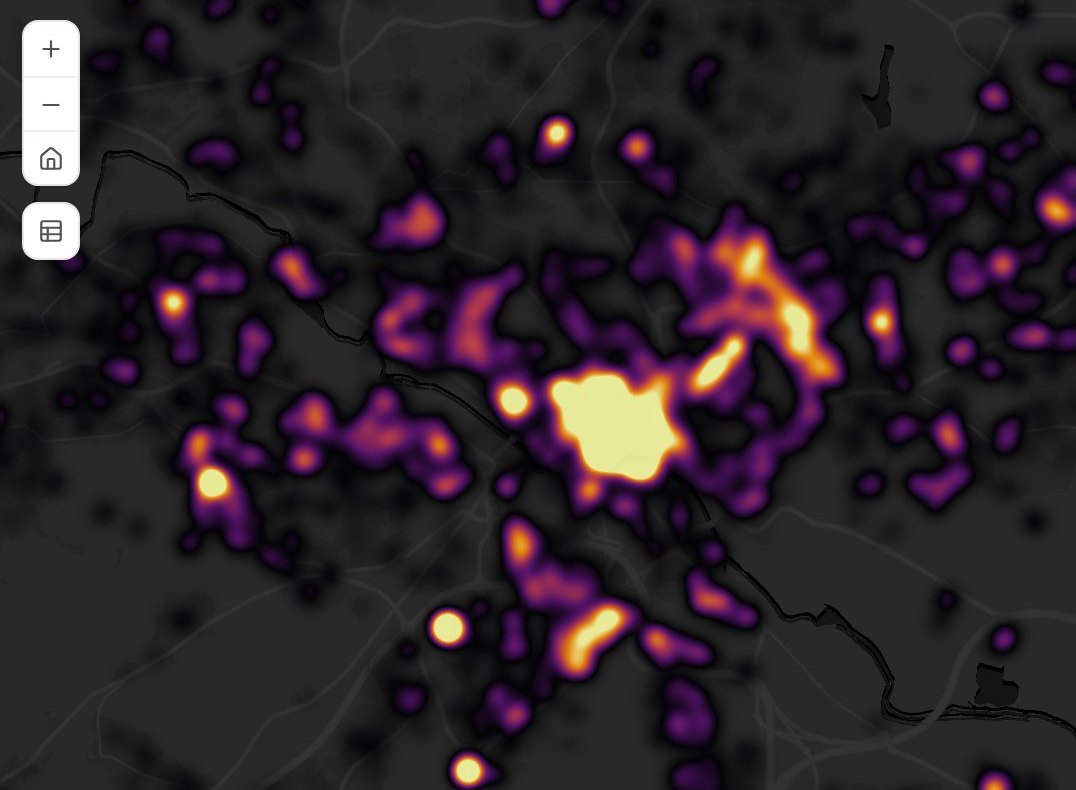
Trip starts
Density
The request
Attached: every trip start from last month, each with a time and a location. Show them as a heat map on a dark basemap so the busy spots stand out, and add a filter for weekdays and weekends.
What came back
- The city’s busy spots at a glance
- A legend that runs from quiet to busy
- One switch between weekdays and weekends
Turn a store list into a map your regional leads can search
Strideline, a running-shoe brand opening stores fast
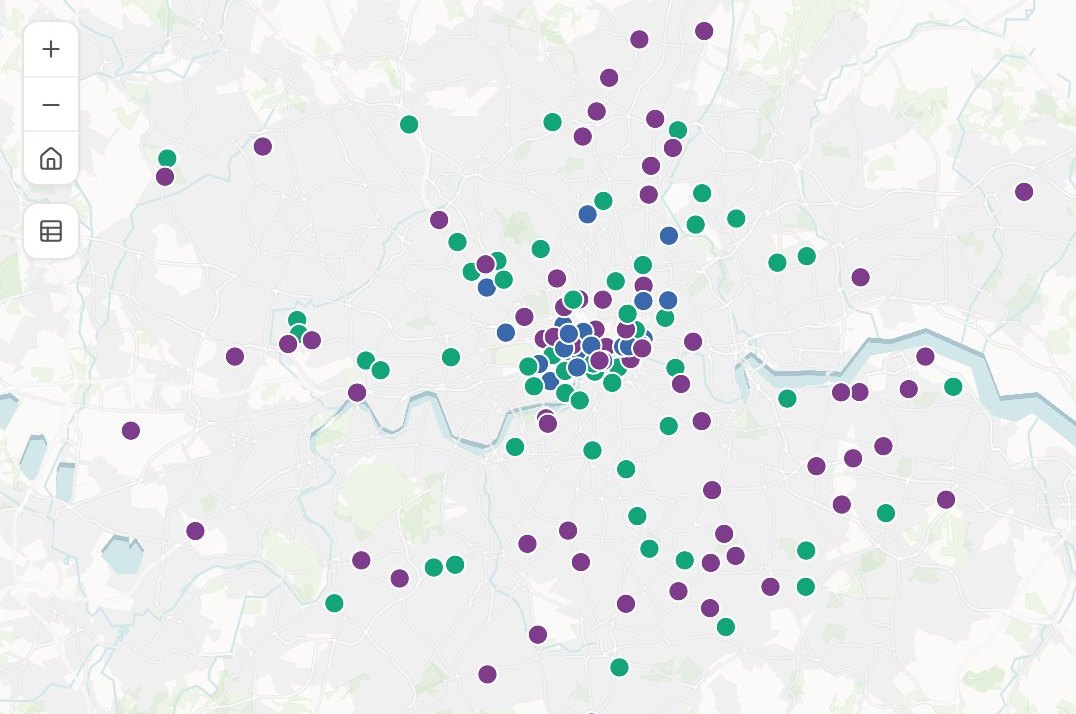
Stores
Format
- Flagship
- High street
- Outlet
Stores by format
- Flagship38
- High street29
- Outlet19
The request
Attached is our store list: every store with its address, region, manager and format (flagship, high street or outlet). Make a map for our regional leads. Colour the stores by format, let them search by store name, and add a chart of stores by format, where clicking a bar highlights those stores on the map.
What came back
- Every store placed from its address
- Search by store name
- A live chart: click a bar and those stores light up
Put your sites on the ground they stand on
Wildmere, a rewilding trust planning its survey season
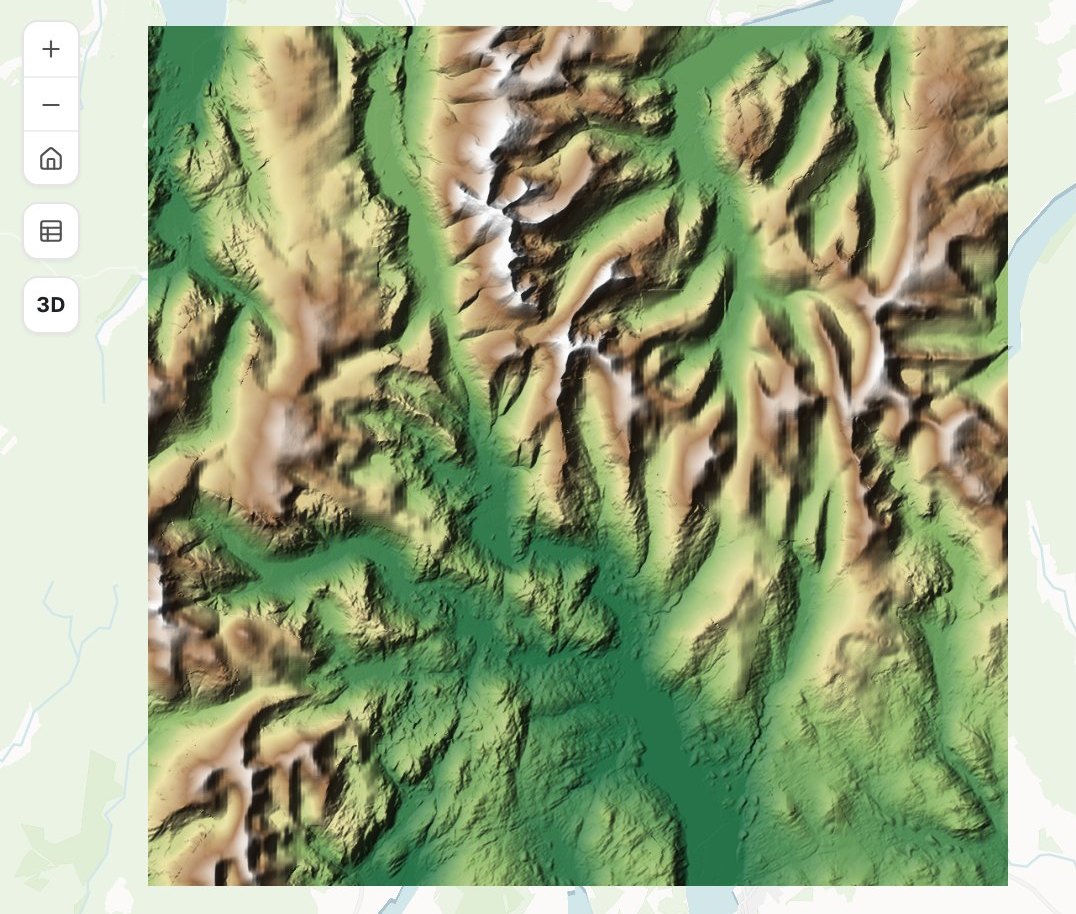 P-04P-07P-11P-12P-15
Height
Metres above sea level
The request
Attached are the elevation model for the estate and this season’s survey plots. Show the ground as shaded relief with a height ramp, put the plots on top labelled by their code, and let the field team search for a plot by its code.
What came back
- The ground in shaded relief, coloured by height
- Every plot on top, labelled by its code
- A plot search the field team can use on a phone
Works alongside the GIS you have
Bring what you already hold. Take away files your other software opens.
- What you bringAttach it, or name something you brought in before.
- ShapefileGeoPackageFile GeodatabaseGeoJSONSpreadsheet or CSVAerial and satellite imageryLiDAR and 3D models
- What Mapstack finds for youAsk, and it goes and gets it. That is time you do not spend searching.
- Public datasets from around the worldData it finds on the web
- What you take awayThe map is yours to pass on, and so is the data under it.
- GeoPackage for your desktop GISGeoJSONCSVA live link
Mapstack does the work. You stay in charge.
You would review a colleague’s map before it went out. It works the same way here.

- See every choice. Each map comes back with what Mapstack decided and why, so the review starts from reasons.
- Change anything by asking. A colour, a class boundary, a label, the whole basemap. Say it and it is done.
- Set your own standards. Give the classes, the palette or the symbols exactly, and they are used exactly.
- Go back whenever you like. Earlier versions are kept, so trying something costs nothing.
- Asked, not assumed. When a request could be read two ways, Mapstack checks with you before it builds.
An example of how it goes
Asked at 10:02. Back by 10:08.
Maya is the one mapping analyst at an electric-vehicle charging network that opens new sites every month. The head of expansion wants an answer for Thursday’s meeting: where are we thin?
- live-chargers.csv
Shade every district by our chargers per thousand households with a car.
Tuesday 10:02
She asks
One paragraph and one file. Then she goes back to her site surveys.
- Chargers per 1,000 households with a car
Tuesday 10:08
The map is back
Household figures found and joined, every district shaded by the gap.
- Chargers per 1,000 households with a car
Use our brand greens, and start the top class at 4.5.
Tuesday 10:15
She changes it by asking
The company’s colours and one class boundary. The same map, updated.
- Chargers per 1,000 households with a carEastgate
Eastgate
1.2 chargers per 1,000 households
Thursday 09:00
Everyone uses it
Each regional lead has looked up their own patch before the meeting starts.
Maya got her afternoon back.
A map that used to take her half a day took a few minutes of her time. She spent the rest on the site surveys only she can do, and the regional leads found their own answers on the map.
The jobs these maps get made for
- Map an official statistic, area by areaA published figure for every small area, shaded by its value.
- Turn an address list into a shared mapFrom a spreadsheet of addresses to a link your team can open.
- Find where incidents really clusterHot spots tested, not just counted.
- Turn a shapefile into a web mapA desktop GIS file, styled and opened from a link.
- Put a plan online for residentsOne public map, a display sheet and a plain page.
- Publish a map that keeps itself currentA public link, refreshed on a schedule.
What it costs
Mapstack is priced per person. Making maps is included for everyone, on the free plan too.
Free
$0for one person
Make maps from your own files. They stay private to you until you choose to publish one with a public link.
Creator
$16a person a month, billed yearly
Adds sharing privately with your team, imagery and 3D on your maps, and maps that update on a schedule.
Creator Max
$80a person a month, billed yearly
The same, with a larger monthly allowance for people who make maps every day.
Colleagues who only need to open the maps take a Viewer seat at $10 a month. They open every map, search and filter it, and ask it questions in plain words: “which districts are below the average?” See every plan.
Common questions
How is this different from asking a chatbot for help with a map?
A chatbot hands you a script or a set of steps, and you still do the work. Mapstack does the work: it brings in the data, builds the map, hosts it and gives you the link. You review a finished map.
What kinds of map can Mapstack make?
Interactive web maps: points, lines and areas coloured by category or by number, sized symbols, heat maps and clusters, 3D, change over time, and your data over aerial imagery or terrain. Each one comes with its legend, popups, search and filters.
How long does a map take?
Usually a few minutes from request to finished map. A change takes about as long as it takes to ask for it.
Do I have to move away from the GIS I use now?
No. Mapstack works alongside it. Bring the files you already have, and take your data back out in standard formats that open in desktop GIS.
Can I trust what Mapstack makes?
You check it the way you would check a colleague’s work. Every map comes back for your review with the reasons for its design, and anything you want changed is changed by asking. Earlier versions are kept.
Can colleagues or clients open a map without an account?
Yes. Send a public link and anyone can open the map, search it and filter it. Inside your team, a Viewer seat lets a colleague open every map and ask it questions.
Is the data I upload private?
Yes, on every plan, Free included. Your files and the maps made from them are private to you by default. Nothing is public unless you choose to publish it, and you can unpublish it again.
What happens to my data?
It stays in your workspace and it stays yours. Only the people you give a seat to can see it. It is not used to train AI, and when you delete it, it is removed.
Ask for your first map.
Free to start. No card.