
A public performance site
Show residents how their area is doing.
Attach the published figures and say what the target is. You get a map of every area by its rate and a plain-English report, both ready to publish.
Free to start. Reports on a paid seat.
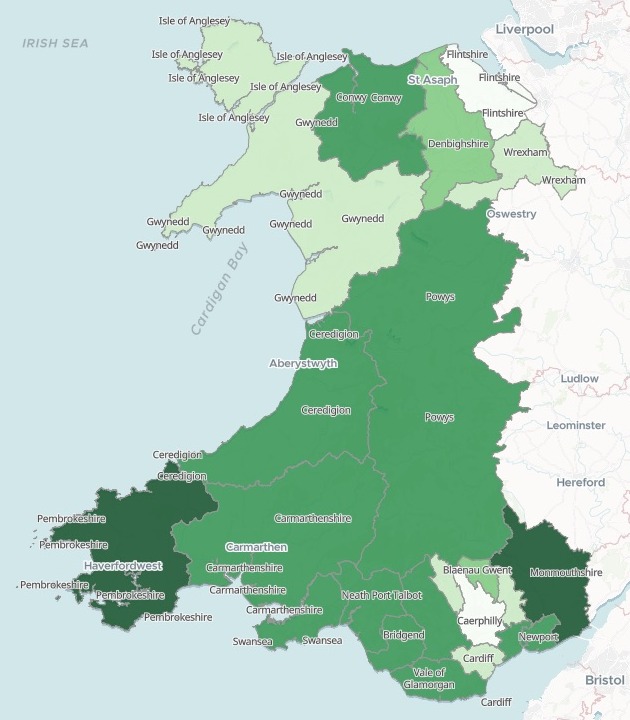
| Recycling rate, 2024-25 | Rate |
|---|---|
| Highest, Pembrokeshire | 73.53% |
| Councils that rose | 20 of 22 |
Darker green, a higher rate. The report says who met the target.
For whoever reports progress to the public
Recycling rates.Response times.Broadband roll-out.The figures are published every year.
Residents still want to know how their own area did.
They look for their own council first, then whether it met the target, and by how much.
From a published table to a map and a report
Columns: Area (each council, and Wales as a whole), Statutory recycling rate 2023-24 (%) (last year’s rate), Statutory recycling rate 2024-25 (%) (this year’s rate). 23 rows. One row for each council, the two years side by side, and no shapes.
What you get
- The council boundaries, found and matched by name.
- A map of every council, shaded by this year’s rate, with a search by name.
- A pop-up for each: this year’s rate, last year’s and the change.
- A short report for residents, in plain English: the key points first, then who met the target, who fell short and the biggest movers as a chart.
One real release
Twelve councils met the target. Wales missed it.
The Welsh Government's recycling rates for all 22 councils, 2023-24 and 2024-25, set against the 70% statutory target every council has had since 2024-25.
- Rose most
- Cardiffup 3.94 points, and still short of the target
- Fell short
- 10councils; Blaenau Gwent missed by 1.11 points
- Wales overall
- 68.39%1.61 points below the target, up from 66.59%
| Furthest below the target | Percentage points |
|---|---|
| Caerphilly | 8.36 |
| Flintshire | 6.82 |
| Cardiff | 5.99 |
| Isle of Anglesey | 5.00 |
| Wrexham | 4.91 |
It kept Wales’s own figure.
The national rate is the one the table gives for Wales, not an average of the councils. Each council’s distance from the target is in percentage points: the plain gap between two rates.
Welsh Government, StatsWales: municipal waste management and reuse, recycling and composting rates by local authority, 2023-24 and 2024-25 (data from Natural Resources Wales, Open Government Licence). Boundaries: local authority districts, from Mapstack’s library. Run on 15 November 2026.
How it goes
You bring the figures. Mapstack brings the boundaries and the words.
Attach the published table and state the target.
Mapstack maps every council and writes the report.
You publish both. Anyone with the link can open them, with no sign-in.
Common questions
What happens to our figures?
It stays in your workspace. Only people with a seat in your workspace can see it. Nothing leaves unless you publish it yourself.
It is not used to train AI. Your data and your conversations are not used to train AI models.
It is still yours. You keep ownership of what you bring in. Delete it and it is removed.
The full answer is in the documentation: Your data, privacy and security.
What does it cost?
Free to start. One seat, for you, with a starter amount of work each month. No card.
The map and its public page are on the free seat. With your own files and public sharing.
The written report is on a paid seat. Paid seats are per person, and bring more work each month.
The prices are on the pricing page.
Can we change it before it goes out?
Yes, by asking. Name the section, the wording or the colours, and say what should change.
Publish when it is right. The map and the report are published separately, each when you are ready.
Make yours.
Free to start. Reports on a paid seat.