
Join a table to area boundaries
Put your table of figures onto its areas.
Attach a table with a figure for each area and a code to match on. You get the figures on a map, and a count of how many rows matched.
Free to start. No card.
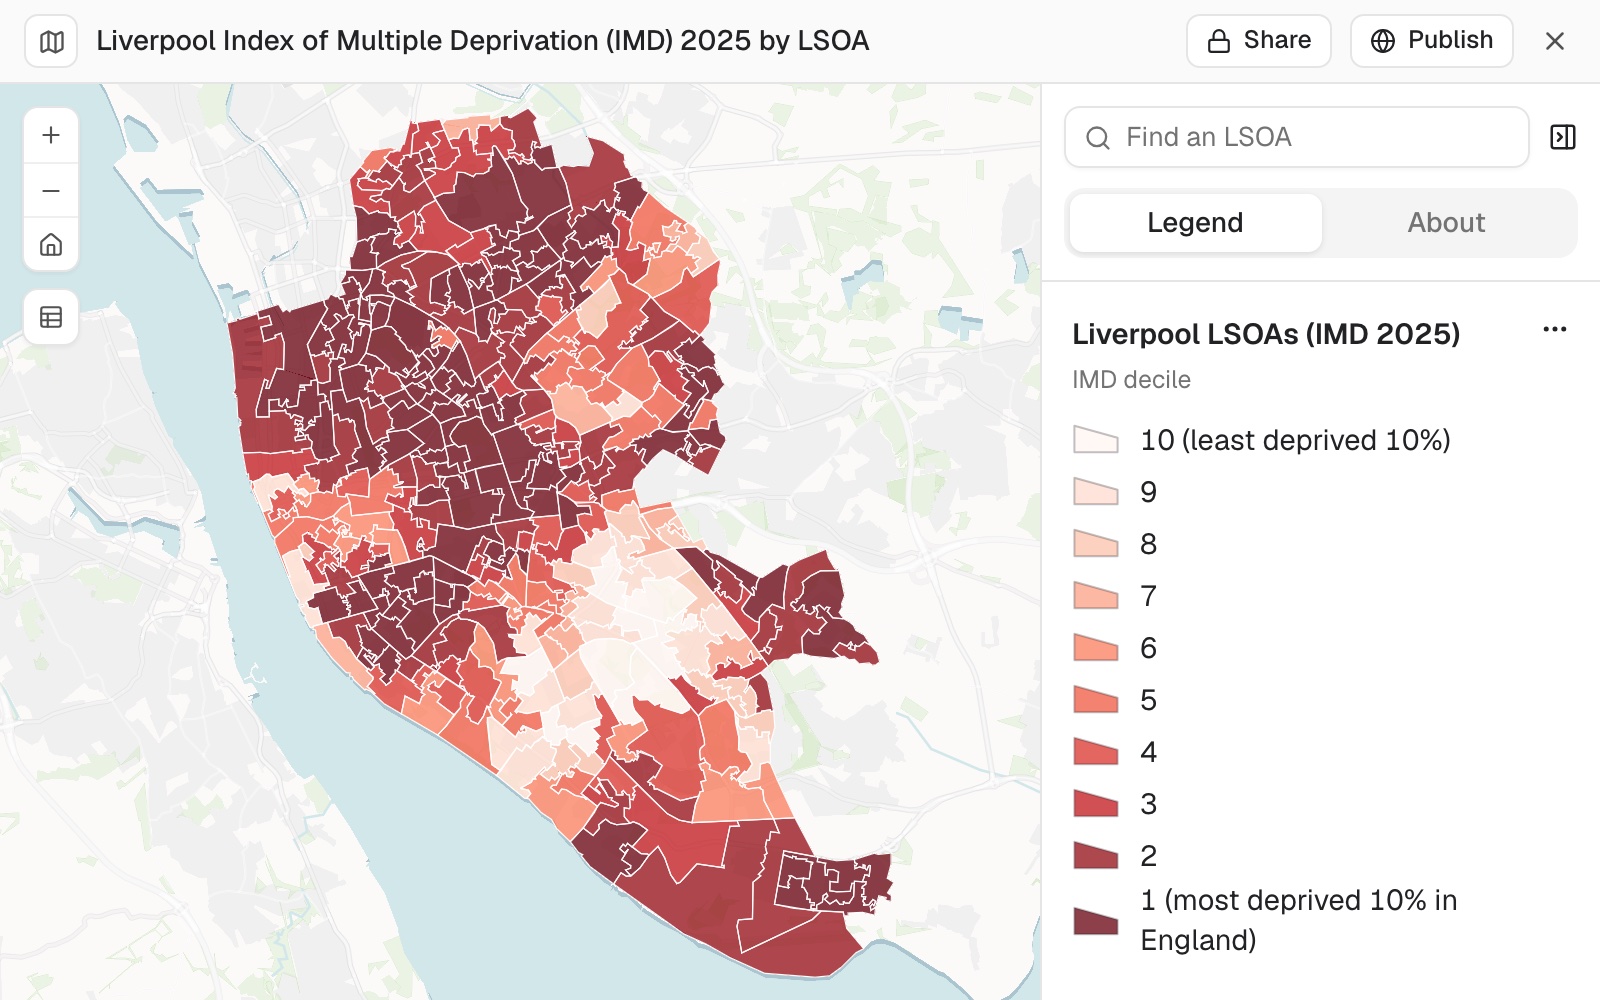
| The join | Areas |
|---|---|
| Rows of the table matched | 302 |
| Boundaries with no row, outside the city | 701 |
| In the most deprived tenth | 111 |
The table had no shapes. Mapstack fetched the boundaries.
For anyone with figures and no shapes
An official statistics table.Survey results by ward.Sales by postcode district.The figures are in a spreadsheet.
The shapes that put them on a map are somewhere else.
Matching rows to shapes on a shared code is called an attribute join, or a table join. It is where most area maps start, and where they stall when the codes do not line up.
Here you attach the table. Mapstack finds the boundaries, does the join and tells you what matched and what did not.
From a table of codes to a map of areas
Columns: LSOA code (the code to match on), IMD score (the deprivation score), IMD decile (1 to 10). 302 rows. A code on every row, no shapes.
What you get
- One dataset: your columns on the boundaries.
- The match, counted on both sides, with the reason for what is left over.
- A map of the column you named, with a legend and a chart of the values.
- The rest of your columns, shown when someone selects an area.
One real table
302 rows in, 302 matched
The English Indices of Deprivation 2025 for Liverpool's 302 small census areas (LSOAs): codes, names and scores, as published.
- Your side
- 302rows, every one matched to a boundary
- The other side
- 701boundaries with no row, all outside the city
- The answer
- 111areas in the most deprived tenth in England
| Boundaries | Number |
|---|---|
| Fetched, for the whole city region | 1,003 |
| Matched to a row of the table | 302 |
| No row: the neighbouring boroughs | 701 |
It reports both sides of the match, and says why.
The boundaries covered more than the table. Mapstack named the 701 left over as the surrounding boroughs: Knowsley, Sefton, St Helens, Wirral and Halton.
Ministry of Housing, Communities and Local Government, English Indices of Deprivation 2025, File 7, cut to Liverpool. Boundaries: Census 2021 LSOAs. Run on 11 November 2026.
Then ask the joined data a question
Once your figures are on the shapes, they answer questions like any other dataset.
A decile, a rank or a category reads best with one class for each value. Ask for it.
How many of Liverpool's areas are in decile 1, and what share of the city's areas is that?
Mapstack answered 111 of 302, 36.75%, with the count and the share for every decile.
How it goes
You bring the table and name the code. Mapstack brings the shapes.
Attach your table and say which boundaries it belongs to.
Mapstack fetches the boundaries, joins them and maps the result.
You get the match, counted.
The step-by-step guide is in the documentation: Join your table to area boundaries and map it.
Common questions
What happens to my table?
It stays in your workspace. Only people with a seat in your workspace can see it. Nothing leaves unless you publish it yourself.
It is not used to train AI. Your data and your conversations are not used to train AI models.
It is still yours. You keep ownership of what you bring in. Delete it and it is removed.
The full answer is in the documentation: Your data, privacy and security.
What does it cost?
Free to start. One seat, for you, with a starter amount of work each month. No card.
This job is on the free seat. Maps, datasets, analysis, your own files and public sharing are all included.
Pay per person for more. A paid seat brings more work each month, and seats for your team.
The prices are on the pricing page.
What if some rows do not match?
You are told. The counts come for each side, on request, with the reason.
Read their codes. A different year of boundaries, leading zeros lost in a spreadsheet, or a name spelled two ways.
Spare boundaries are normal. They appear when the boundaries cover more than your table does.
Join yours.
Free to start. No card.