
Parcels affected by a rezoning
See every parcel a rezoning touches.
Attach the rezoning areas, your parcel map, the zoning map and the council districts. You get every parcel affected, its zoning now and proposed, on a map.
Free to start. Reports and prints on a paid seat.
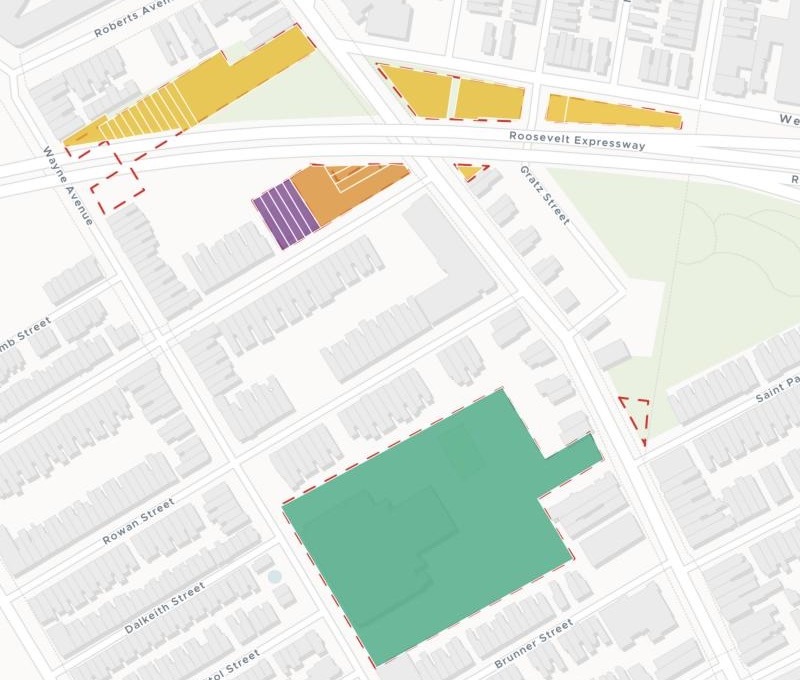
| On the map | |
|---|---|
| To SP-CIV | |
| To SP-PO-A | |
| To CMX-2 | |
| To RSA-5 | |
| Remapping bill area, dashed |
Each parcel is filled by the zoning the bill would give it.
For whoever briefs council on a rezoning
A rezoning bill draws areas on a map.
Council offices ask about properties: which ones, in whose district, and what each one becomes.
Rezoning many parcels at once by area is often called remapping. Before a hearing, someone turns the areas into a list of properties.
One real city
Every parcel the bills before council would rezone
Philadelphia’s pending remapping bills, the Water Department’s parcel map, the current zoning map and the 2024 council districts, all from the City’s open data.
- Parcels
- 193that the bills before council would rezone
- Rezoned
- 49.05acres in all, parcel by parcel
- Districts
- 7council districts, each with its bills summed up
- To RSA-5
- 63
- To SP-CIV
- 61
- To RSA-6
- 21
- To SP-PO-A
- 17
- To RM-3
- 13
- To CMX-3
- 7
- To CMX-2
- 5
- To CMX-2.5
- 3
- To CMX-1
- 2
- To CMX-4
- 1
It fills in what the bill leaves blank.
Each parcel’s zoning now comes from the zoning map, not the bill, so the list says what changes for that property: RM-1 to RSA-5 on one bill, four different zones to SP-CIV on another.
City of Philadelphia open data: Proposed Zoning Implementation (bills marked Pending or Introduced), PWD Parcels, Zoning Base Districts and Council Districts 2024, downloaded 15 November 2026. Run on 15 November 2026.
What it works out for each parcel
One row a parcel, ready for the briefing.
The bill it falls under, and how much of it is inside. Parcels below your share are left out as slivers.
Its council district, from the district boundaries you attach.
Its zoning now and after, side by side.
The share and the acres rezoned, then a summary by district and bill, grouped by the change from and to.
How it goes
You bring the bills and the maps. Mapstack does the overlay and the counting.
Attach the bills, parcels, zoning and districts and say how to treat the edges.
Mapstack finds every parcel and maps it by proposed zoning.
You get what changes, in acres.
Then take it to council
The list is the start of the briefing. Each of these is something you can ask for today.
Hand it to each office
The same answer, in the form each office wants.
- Keep the affected parcels as a dataset I can download as a spreadsheet for the council offices.
- Publish the map so council staff can open it from a link.
Write it up
For the committee and its slides.
- Write a briefing report for council from these results.
- Make a print of the map for the committee presentation.
Common questions
What happens to our parcel data?
It stays in your workspace. Only people with a seat in your workspace can see it. Nothing leaves unless you publish it yourself.
It is not used to train AI. Your data and your conversations are not used to train AI models.
It is still yours. You keep ownership of what you bring in. Delete it and it is removed.
The full answer is in the documentation: Your data, privacy and security.
What does it cost?
Free to start. One seat, for you, with a starter amount of work each month. No card.
The parcel list, the summary and the map are on the free seat. With your own files and public sharing.
A written briefing report or a print is on a paid seat. Paid seats are per person, and bring more work each month.
The prices are on the pricing page.
Which parcels count?
You set the share. A parcel counts when that much of it is inside a bill area; slivers along the edges are left out.
The full list is a dataset. Filter it by district or bill, or download it for your GIS.
Brief yours.
Free to start. Reports and prints on a paid seat.