
Forest inventory and harvest planning
Turn your stand data into a felling programme.
Attach your subcompartment data and paste in your yield table. You get a felling programme mapped by year, with each year’s area and volume.
Free to start. No card.
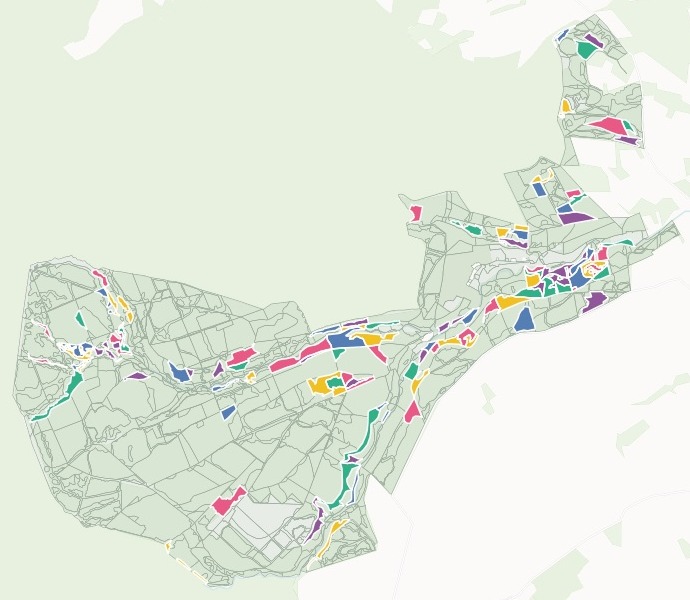
| Felling year | Stands |
|---|---|
| 2027 | 17 |
| 2028 | 18 |
| 2029 | 18 |
| 2030 | 18 |
| 2031 | 18 |
| The rest of the forest | 681 |
Click a stand for its compartment, species, planting year, area, volume and felling year.
For whoever writes the felling plan
Forest planners, estate foresters, woodland managers: the plan needs the stand data and the yield table, stand by stand.
Every stand has its species, its planting year and its yield class. Your yield table turns those into a volume, and your rule turns the volumes into a list to fell.
Here you attach the stand data and paste in the figures you use. Mapstack does the lookups, picks the stands and sets them out year by year.
One real forest
Five years of clearfell in Hamsterley Forest
Forestry England's own stand data for Hamsterley Forest in County Durham, and the felling yields from the Forestry Commission's Booklet 34, pasted into the chat line by line.
- Standing volume
- 72,636 m³in the 89 stands chosen to fell
- Clearfell
- 253.29 haover the five years, from 2027 to 2031
- Heaviest stand
- 7117/ASitka spruce planted in 1940: 7.30 ha, 3,798.0 m³
| Felling year | Standing volume | Area |
|---|---|---|
| 2027 | 17,708.2 m³ | 57.00 ha |
| 2028 | 16,543.4 m³ | 55.21 ha |
| 2029 | 14,222.1 m³ | 44.38 ha |
| 2030 | 12,722.2 m³ | 48.37 ha |
| 2031 | 11,439.8 m³ | 48.33 ha |
It applies your rule as you write it.
Here: conifers at or past the age of maximum mean annual increment for their species and yield class, from the table, plus all larch because of Phytophthora ramorum. No broadleaves, and nothing under a hectare.
Forestry England, Subcompartments, February 2026 edition, Forestry Commission open data, trimmed to Hamsterley Forest. Forestry Commission Booklet 34, Forest Management Tables (Metric), felling yields to 7 cm top, over bark. Run on 15 November 2026.
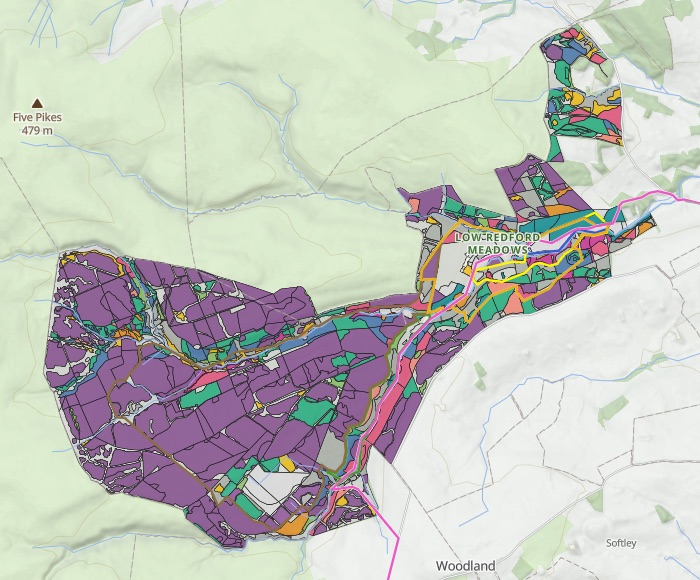
The forest by species and age, before anything is felled
The stands mapped by main species, and the area in every 10-year age class, worked out from the planting years.
- Sitka spruce, in purple: 1,073.00 ha. Nearly half the forest.
- The big age classes, 20 to 39 years. 402.50 ha and 410.10 ha, across all species.
- Larch counted on its own. 143.10 ha of Japanese, hybrid and European larch, by age class.
Where your table has no figure, it says so
Tell it not to guess, and it lists what it left out.
The list tells you which yield lines you are missing, stand by stand.
Where a stand's species or yield class is not in the table, do not make up a figure: leave its volume blank and tell me which stands those are and their area.
40 stands, 83.21 ha, left blank. 22 are species the table does not have: mixed conifers, lodgepole and Corsican pine, grand fir, western red cedar and Wellingtonia. 18 are yield classes it does not reach, such as Douglas fir at yield class 8. Each one is listed by compartment, subcompartment and area.
How it goes
You bring the stand data, the yield figures and your rule. Mapstack does the lookups and the map.
Attach your stand data and paste in your yield table.
Mapstack maps the programme by felling year.
Click any stand for its figures.
Common questions
What happens to our stand data?
It stays in your workspace. Only people with a seat in your workspace can see it. Nothing leaves unless you publish it yourself.
It is not used to train AI. Your data and your conversations are not used to train AI models.
It is still yours. You keep ownership of what you bring in. Delete it and it is removed.
The full answer is in the documentation: Your data, privacy and security.
What does it cost?
Free to start. One seat, for you, with a starter amount of work each month. No card.
This job is on the free seat. Maps, datasets, analysis, your own files and public sharing are all included.
Pay per person for more. A paid seat brings more work each month, and seats for your team.
The prices are on the pricing page.
What do I get?
A volume for every stand your table covers. From its species, yield class and age, interpolated between your table’s 5-year steps.
The stand list, year by year. Compartment, subcompartment, species, planting year, area and volume for every stand chosen.
A map to share. Publish it for the plan review, and find any compartment by its number.
Plan yours.
Free to start. No card.