
Map graphics for news and social
Turn the latest figures into a social post.
Attach the latest figures by area. You get a social post: a shaded map, a headline that states the finding, and callouts on the biggest rise and fall.
Free to start. Posts, prints and articles on a paid seat.
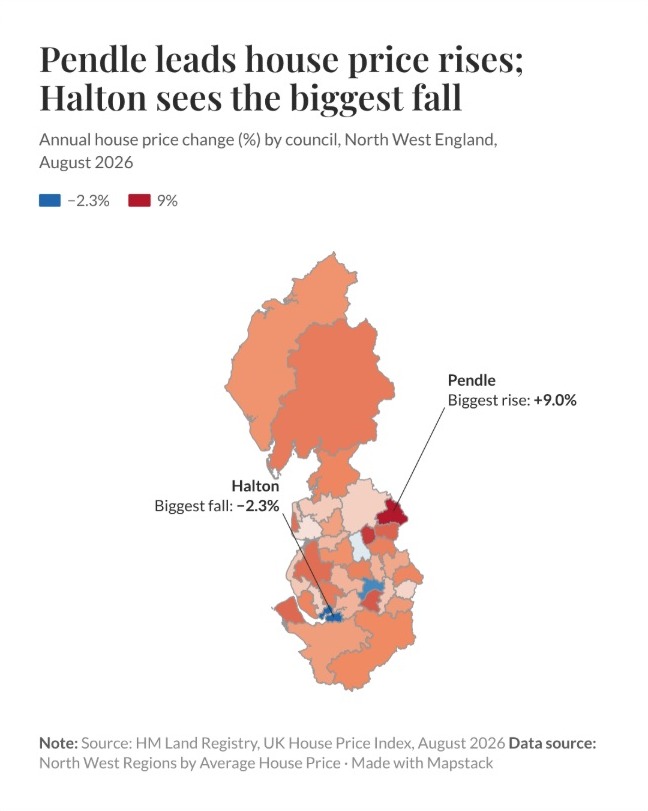
| Annual change in average price | |
|---|---|
| Biggest rise | Pendle |
| Biggest fall | Halton |
| Source line | HM Land Registry |
The headline states the finding, and the callouts name the two ends.
For the graphics desk on deadline
The figures land in the morning.The story runs tomorrow.
Social needs a graphic that says the finding at a glance, and the copy needs the numbers behind it.
A map shaded area by area is a choropleth. On social it needs more than the shading: a headline that says what happened, the places that matter called out, and the source.
Here you attach the release. Mapstack finds the boundaries, shades every area, writes the headline from the figures and lays out the post.
From the release to the post
Columns: Region_Name (the council), Average_Price (in pounds), Annual_Change (on a year before, in %). 35 rows. Also the month and each council’s official code, as the Land Registry publishes it, cut to one region and one month.
What you get
- A social post with a headline that states the finding, not the topic.
- Callouts on the council with the biggest rise and the one with the biggest fall.
- Your source line on the post, under the map.
- The figures for the copy: the five biggest rises and every fall, each with its average price.
One real release
The figures for the copy, in the same reply
HM Land Registry’s UK House Price Index for August 2026, published 21 October, cut to the council areas of North West England. Mapstack found the official council boundaries itself.
- Where prices rose
- 32 of 35councils, from Pendle at the top down
- Where prices fell
- 3 of 35councils: Halton, Salford and Blackburn with Darwen
| Council | Average price | Annual change | |
|---|---|---|---|
| Pendle | £156,011 | +9.0% | |
| Hyndburn | £142,964 | +7.6% | |
| Trafford | £393,897 | +6.4% | |
| Burnley | £136,703 | +6.0% | |
| Wirral | £221,673 | +5.8% | |
| Blackburn | £160,727 | −0.2% | |
| Salford | £223,323 | −1.7% | |
| Halton | £189,435 | −2.3% | |
The five biggest rises, then the three falls.
The post shades them the same way: rises in red, falls in blue.
HM Land Registry, UK House Price Index, average prices, August 2026, published 21 October 2026 (Open Government Licence). Council boundaries: Office for National Statistics, brought in by Mapstack. Run on 15 November 2026.
How it goes
You bring the release. Mapstack brings the boundaries and lays out the post.
Attach the release and say what the post should show.
Mapstack makes the post and gives you the figures.
You download it for social.
Common questions
What happens to our figures?
It stays in your workspace. Only people with a seat in your workspace can see it. Nothing leaves unless you publish it yourself.
It is not used to train AI. Your data and your conversations are not used to train AI models.
It is still yours. You keep ownership of what you bring in. Delete it and it is removed.
The full answer is in the documentation: Your data, privacy and security.
What does it cost?
Free to start. One seat, for you, with a starter amount of work each month. No card.
The figures for your copy are on the free seat. With your own files and public sharing.
The social post, a print or an article is on a paid seat. Paid seats are per person, and bring more work each month.
The prices are on the pricing page.
Where do the boundaries come from?
Mapstack finds them. Here, the official council boundaries from the Office for National Statistics.
Every area is placed. All of the region’s councils, Cumberland and Westmorland and Furness included.
They are kept as a dataset. The boundaries sit in your workspace beside your figures.
Post yours.
Free to start. Posts, prints and articles on a paid seat.