
Exposure for a hazard mitigation plan
See what each hazard puts at risk.
Attach your hazard areas, your building inventory and your critical facilities. You get the buildings and facilities inside each hazard, counted in one table and mapped.
Free to start. Reports and prints on a paid seat.
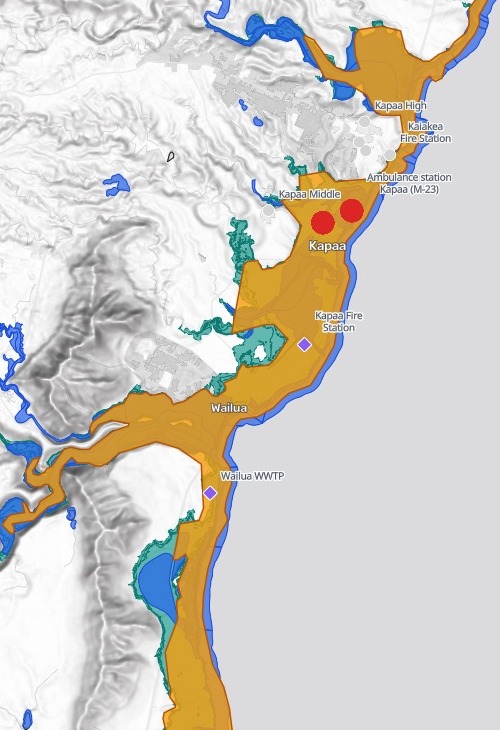
| Hazard areas, and the facilities on them | Buildings |
|---|---|
| Tsunami evacuation zone | 5,720 |
| FEMA 1% annual chance flood areas | 3,978 |
| Coastal flood with 3.2 ft of sea level rise | 6,112 |
| Facility inside all three | |
| Facility inside the tsunami and coastal flood zones | |
| Facility inside none |
At Kapaa, the police station and the ambulance station sit inside all three.
For whoever updates the hazard mitigation plan
The risk assessment needs the counts.
The hazard maps are in one file, the buildings in another, the fire stations and schools in a third.
Counting what sits inside each hazard area is the exposure part of the plan: the buildings, and the critical facilities a community leans on in an emergency, such as fire stations, schools and treatment plants.
Here you attach all of it. Mapstack lays every building and every facility over every hazard, counts them and names them.
One real island
Kauai’s buildings, counted hazard by hazard
The island of Kauai, Hawaii: three hazard areas from the Hawaii Statewide GIS Program, and FEMA's USA Structures building inventory, with a point for every building on the island and its occupancy class.
- Homes inside at least one
- 5,487residential buildings in the tsunami zone, the flood areas or the sea-level-rise zone
- Widest reach
- 6,112buildings in the coastal flood with 3.2 ft of sea level rise, more than either other hazard
- Inside at least one
- 6,802buildings, of 33,001 on the island
| Each hazard area | Residential buildings |
|---|---|
| Tsunami evacuation zone, 2025 | 4,550 |
| FEMA 1% annual chance flood areas | 3,342 |
| Coastal flood with 3.2 ft of sea level rise | 4,874 |
One rule for every count.
A building counted as inside when its point fell inside the hazard area, as the request asked.
Hawaii Statewide GIS Program: Kauai tsunami evacuation zone (County of Kauai, 2025), Kauai County flood hazard areas (FEMA, October 2026), 1% annual chance coastal flood zone with 3.2 ft sea level rise. FEMA and Oak Ridge National Laboratory, USA Structures. Run on 15 November 2026.
Where the hazards stack up
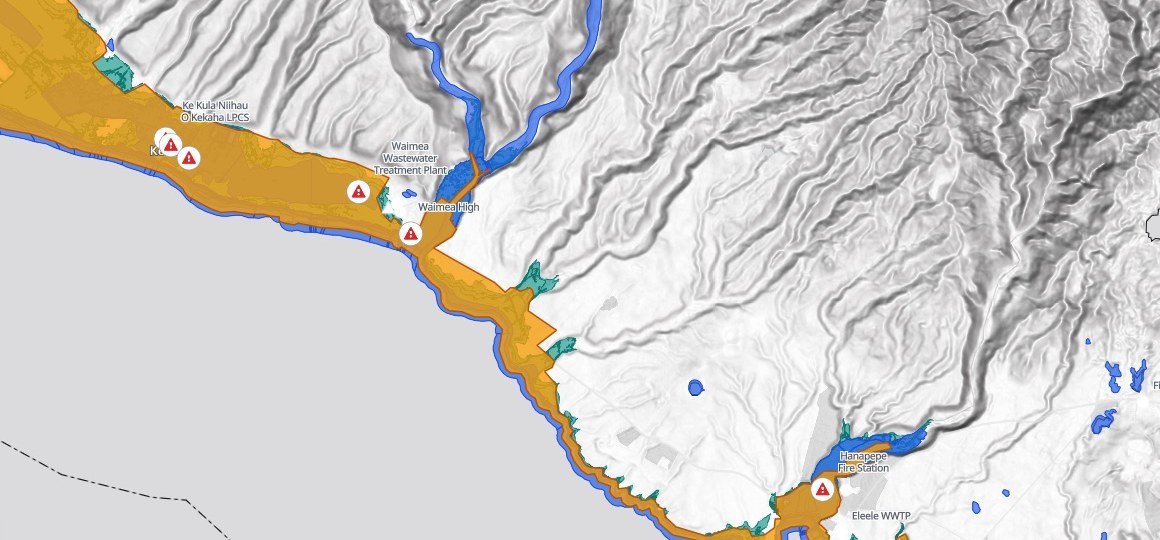
Kauai’s west side, from Kekaha to Hanapepe. Each red triangle is a facility inside all three hazard areas.
- Waimea in all three. Its fire station, police station and wastewater treatment plant sit inside the tsunami zone, the flood areas and the sea-level-rise zone at once.
- Kekaha’s three schools, and Hanapepe Fire Station. Inside all three as well, each named in the list.
Every facility, by name
The critical facilities inside each hazard
Fire, police and ambulance stations, hospitals, public schools and the public wastewater treatment plants: 45 places, each checked against all three hazards.
- Hospitals
- 0hospitals inside a hazard area, of the three on the list
- Inside all three
- 11facilities in the tsunami zone, the flood areas and the sea-level-rise zone at once
- Exposed
- 17facilities inside at least one hazard, every one named
- Inside all three
- 11
- FEMA flood areas only
- 3
- Tsunami and coastal flood
- 2
- Coastal flood only
- 1
- Inside none
- 28
Listed both ways round.
By hazard, every facility inside it. By facility, each one with the hazards it sits in.
Hawaii Statewide GIS Program: fire, police and EMS stations, hospitals, public schools and wastewater treatment plants on Kauai. Run on 15 November 2026.
How it goes
Five files, one request, one answer.
Attach the hazards, the buildings and the facilities and say how a building counts as inside.
Mapstack lays them over each other and maps the hazards with every facility on them.
You get each facility’s hazards.
Common questions
What happens to our facility list?
It stays in your workspace. Only people with a seat in your workspace can see it. Nothing leaves unless you publish it yourself.
It is not used to train AI. Your data and your conversations are not used to train AI models.
It is still yours. You keep ownership of what you bring in. Delete it and it is removed.
The full answer is in the documentation: Your data, privacy and security.
What does it cost?
Free to start. One seat, for you, with a starter amount of work each month. No card.
The counts, the facility lists and the map are on the free seat. With your own files and public sharing.
A printable map or a written report is on a paid seat. Paid seats are per person, and bring more work each month.
The prices are on the pricing page.
What do I attach?
Your hazard areas. One file for each, as zipped shapefiles. Hundreds of shapes in one file is fine.
Your building inventory. A spreadsheet with a point for each building and its occupancy class.
Your critical facilities. A list with each one’s name, type and where it is.
Check yours.
Free to start. Reports and prints on a paid seat.