
Space-time patterns
See when and where incidents happen.
Attach a log of incidents with a date and a time on each. You get the worst hours, days and months, and a map coloured by time of day.
Free to start. No card.
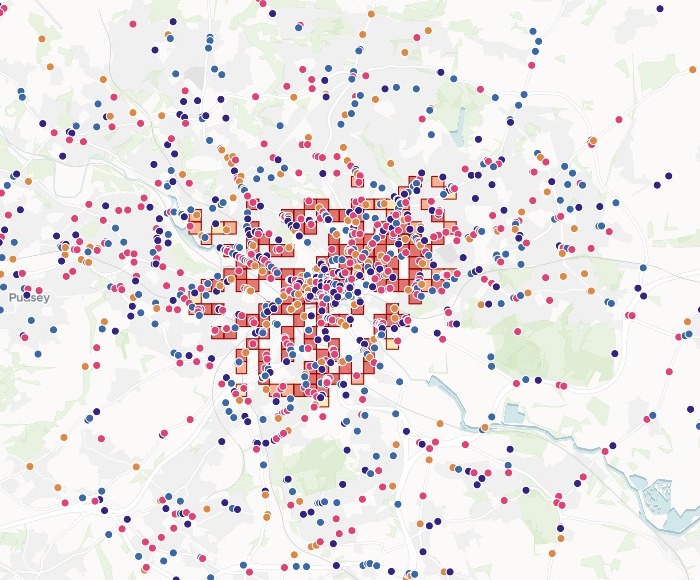
| By time of day | Collisions |
|---|---|
| Evening peak | 469 |
| Daytime | 395 |
| Night | 384 |
| Morning peak | 215 |
| Rush-hour hot spot |
Red squares mark the rush-hour hot spots. Night's are a layer you switch on.
For whoever has to time the work
Road safety teams.Police analysts.Anyone with a log of incidents, each with a date and a time.Where things happen is half the answer.
When is the other half.
Looking at when and where together is what mapping people call space-time analysis. It says which hours to staff, which days to run a campaign, and whether the night needs different places from the rush hour.
Here you attach the log and name the times of day you work to. Mapstack counts them, maps them and compares them.
One real year
1,463 collisions, sorted by the clock
Every reported injury road collision in Leeds in 2024, from the Department for Transport's road safety data, each with its date, time, place and severity.
- Worst hour
- 5pm135 collisions in that one hour, against 87 at 8am, the morning's worst
- Worst day
- Friday16.1% of the year's collisions. Sunday had the fewest.
- Worst month
- September141 collisions. April had the fewest, with 107.
| Collisions by day of the week | Collisions |
|---|---|
| Friday | 236 |
| Thursday | 226 |
| Monday | 211 |
| Wednesday | 208 |
| Saturday | 204 |
| Tuesday | 203 |
| Sunday | 175 |
It notices what goes with the timing.
Night collisions: over 76% in the dark. Rush-hour collisions: over 76% in daylight. The same share, the other way round, read from the lighting column without being asked.
Department for Transport, Road Safety Data: road casualty statistics, collisions 2024, trimmed to Leeds. Open Government Licence. Run on 15 November 2026.
Is night different from the rush hour?
Ask for the hot spots, squares with more collisions than chance would explain, for each time of day.
The two sets share a centre. The night-only squares are the difference.
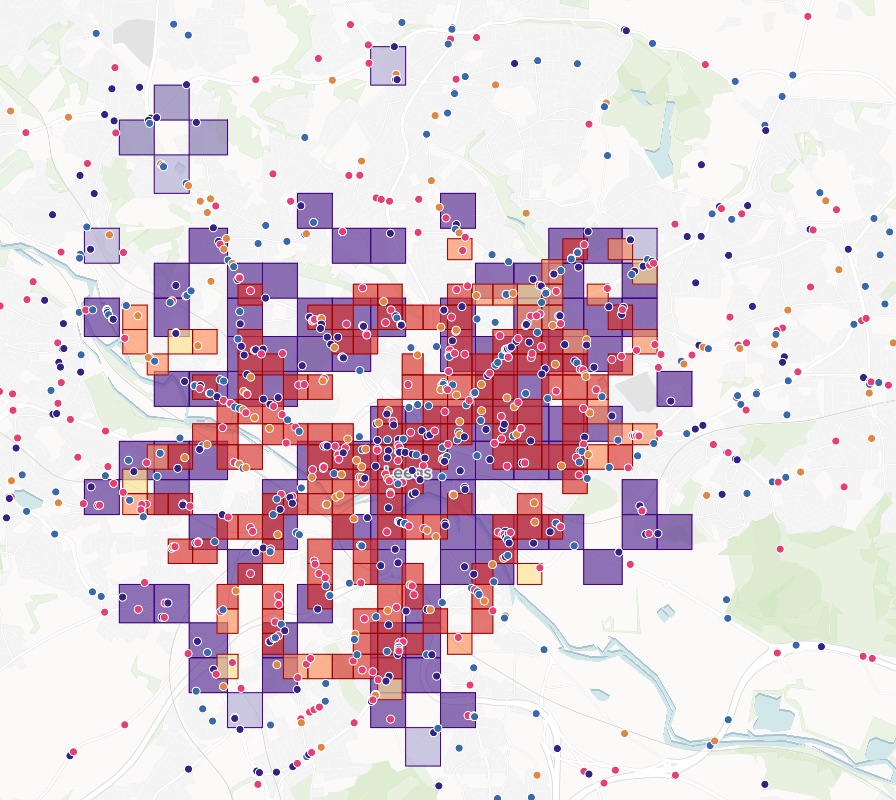
Add the hot spots as two layers I can switch between: the rush hours (morning and evening peaks together) and night. Which ones are hot only at night?
Two layers you switch between, one for the rush hours and one for night. Mapstack listed the 26 squares that are hot spots at night but touch no rush-hour hot spot, with how sure it is of each.
Both layers on one map
Rush hours in reds, night in purples. Switch either off in the legend.
- Each square is shaded by how sure Mapstack is: 90, 95 or 99%.
- Where they overlap, the place is busy at both times.
- The dots stay underneath, each collision in the colour of its time of day.
How it goes
You bring the log. Mapstack does the counting and the map.
Attach the log and name your times of day.
Mapstack maps them by time of day, with a slider for the year.
You get the when, in writing.
Common questions
What happens to our collision data?
It stays in your workspace. Only people with a seat in your workspace can see it. Nothing leaves unless you publish it yourself.
It is not used to train AI. Your data and your conversations are not used to train AI models.
It is still yours. You keep ownership of what you bring in. Delete it and it is removed.
The full answer is in the documentation: Your data, privacy and security.
What does it cost?
Free to start. One seat, for you, with a starter amount of work each month. No card.
This job is on the free seat. Maps, datasets, analysis, your own files and public sharing are all included.
Pay per person for more. A paid seat brings more work each month, and seats for your team.
The prices are on the pricing page.
What does the file need?
A date and a time. On each row. The hour, the day and the month come from them.
Where it happened. Coordinates, as here, or an address to place.
Anything else you keep. Severity, casualties, lighting: each comes through to the map.
Find your when and where.
Free to start. No card.