
Housing development tracker
Track new homes district by district.
Attach your building permits and district boundaries. You get the permits and net new homes counted for every district and year, on a map.
Free to start. Reports on a paid seat.
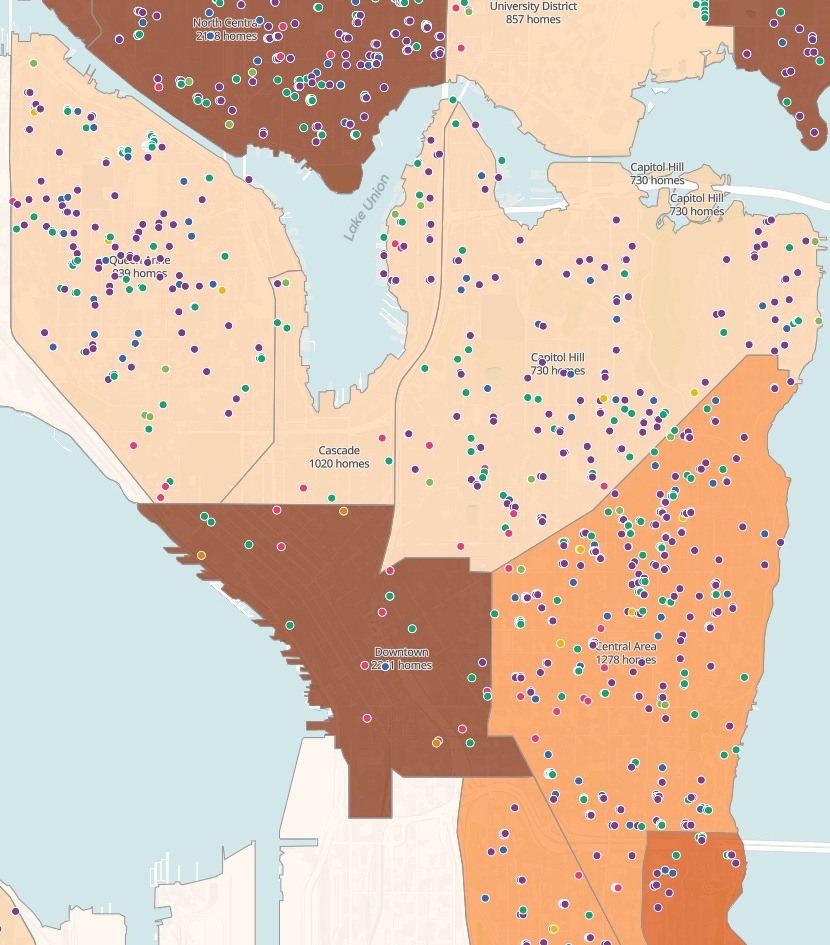
| Seattle, January 2023 to October 2026 | Net new homes |
|---|---|
| All 20 districts | 23,759 |
| Darkest districts | 2,188 and above |
| The next shade | 1,888 to 2,188 |
| Middle shade | 1,265 to 1,888 |
| Light shade | 611 to 1,265 |
| Lightest shade | Below 611 |
| Dots: permits, coloured by kind of housing | 5,488 |
Homes added minus homes removed, on every permit, counted in the district it sits in.
For whoever reports on new housing
City planning teams.Housing teams.Research officers.The permits are in the open data.
Residents want to know where the new homes are going.
A count of permits is not a count of homes: a tower and a backyard cottage are one permit each. Net new homes are the homes a permit adds, minus the homes it removes.
Permits on their way to becoming homes are the housing pipeline. Here you attach them with your districts, and Mapstack counts them, maps them and writes them up.
One real city
More permits this year, fewer new homes
Every building permit Seattle issued from January 2023 to the end of October 2026 that adds homes, from the city's open data, counted in its 20 Neighborhood Map Atlas districts.
- Sharpest fall
- 142net new homes in Rainier Valley in 2025, after over 800 a year in 2023 and 2024
- Biggest surge
- Northeastfrom 147 net new homes in 2023 to 1,381 in 2025
- This year so far
- −19.7%net new homes in the first three quarters, January to September, against the same months of 2025, while permits rose 2.9%
| Districts with the most net new homes | Net new homes | Permits |
|---|---|---|
| Ballard | 2,394 | 478 |
| Northeast | 2,333 | 431 |
| Downtown | 2,241 | 26 |
| North Central | 2,188 | 478 |
| Rainier Valley | 1,941 | 342 |
It counts homes, not just permits.
Downtown is third from a fraction of the permits: its homes come in towers. Northwest issued the most permits of any district, 588, and is not in the top five.
City of Seattle open data: Building Permits issued 1 January 2023 to 31 October 2026 that add at least one home (Public Domain), and the Neighborhood Map Atlas districts (PDDL). Run on 15 November 2026.
Ask how the mix of housing has changed
It reads the city's own categories, and notices when the city stops filling them in.
A change in how a source is filled in is not a change in what was built. It tells you which is which.
How has the mix of housing kinds changed since 2023?
The city's housing category is mostly blank from 2025: unclassified permits rose from 6.1% in 2023 to 81.2% this year. So it also read the permit class, which is filled in every year. Multifamily fell from 58.8% of homes added to 34.5%; single family and duplex rose from 30.7% to 42.7%.
How it goes
Attach the permits and your districts and say what to count.
Mapstack counts and maps them, every permit on top.
You get the city by year. Net new homes, year by year.
Common questions
What happens to our permit data?
It stays in your workspace. Only people with a seat in your workspace can see it. Nothing leaves unless you publish it yourself.
It is not used to train AI. Your data and your conversations are not used to train AI models.
It is still yours. You keep ownership of what you bring in. Delete it and it is removed.
The full answer is in the documentation: Your data, privacy and security.
What does it cost?
Free to start. One seat, for you, with a starter amount of work each month. No card.
The map and the figures are on the free seat. With your own files and public sharing.
The written report is on a paid seat. Paid seats are per person, and bring more work each month.
The prices are on the pricing page.
What counts as a net new home?
Homes added, minus homes removed. On each permit, counted in the year and quarter it was issued.
Homes permitted, not homes finished. The report says so, and gives the current status of the largest permits.
A part year is marked. Where the latest year is not over, every table says how far it runs.
Track yours.
Free to start. Reports on a paid seat.