
A surface from sample points
Estimate a value across a whole area.
Attach the readings from your monitors, wells or soil samples. You get a map of the estimated value everywhere, by kriging, with the uncertainty and the method.
Free to start. No card.
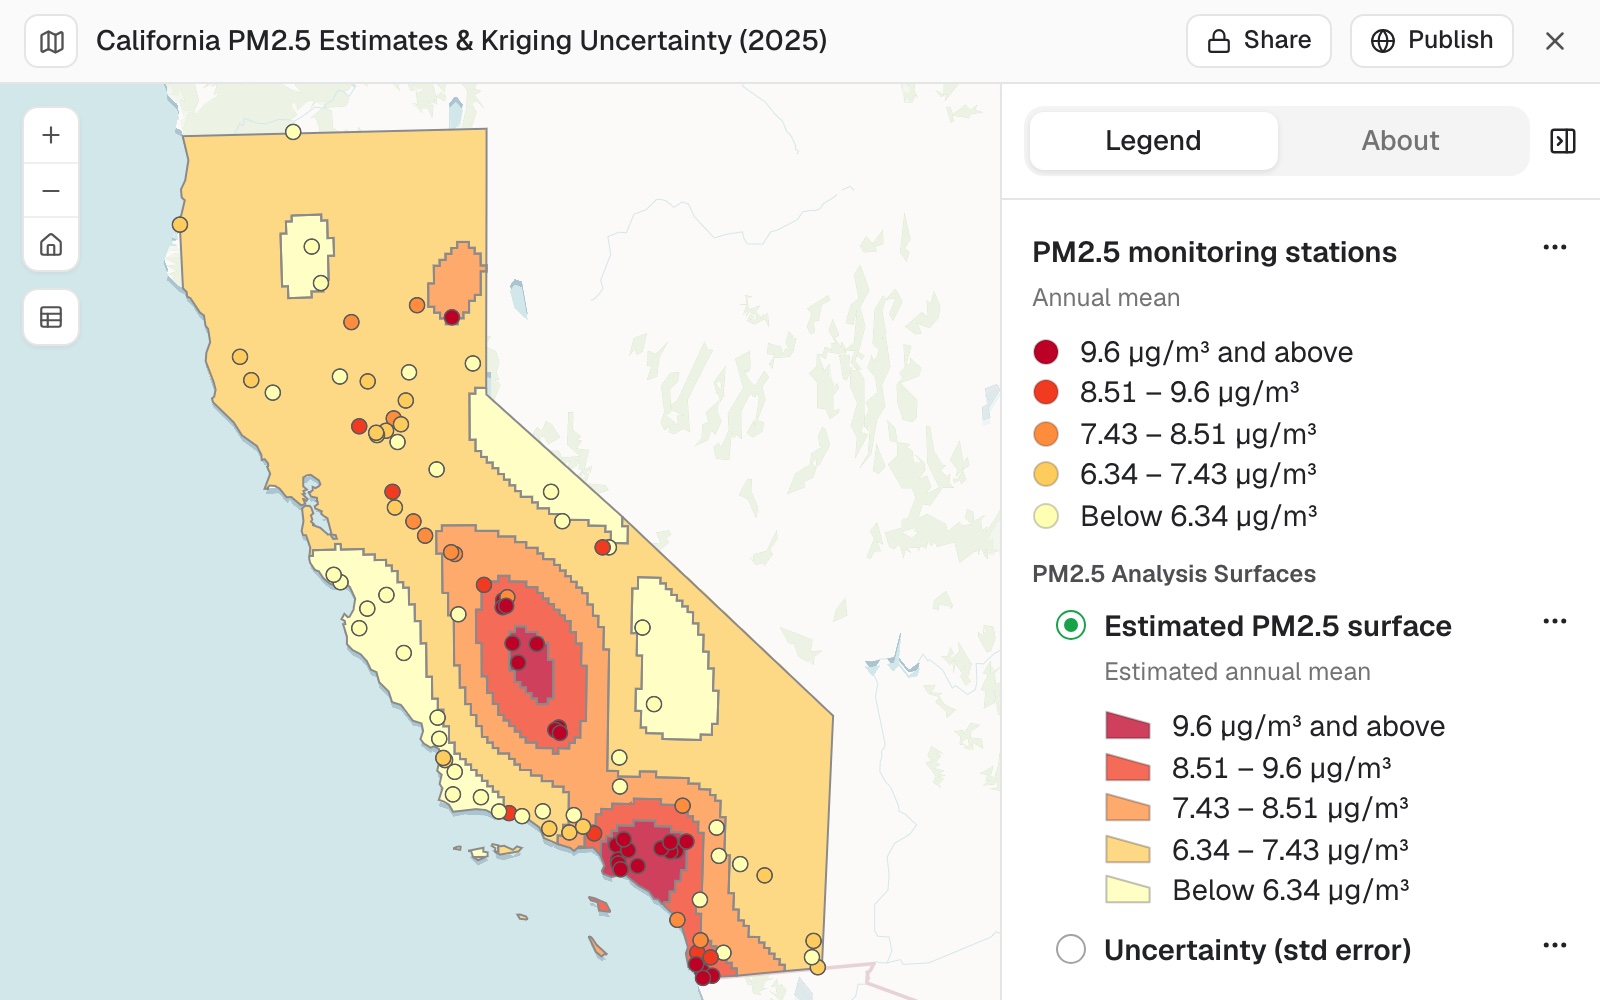
| From 101 monitors | |
|---|---|
| Lowest band, µg/m³ | Under 6.34 |
| Highest band, µg/m³ | 9.6+ |
| Grid cell | 6.8 km |
Estimates ran from 5.26 to 10.68 µg/m³; the readings from 2.67 to 14.2.
For anyone with readings at a handful of places
Air-quality monitors.Boreholes.Soil samples.Rain gauges.You know the value where you measured.
The question is everywhere in between.
Kriging is a kind of interpolation. It estimates the value at every spot from the readings around it, weighted by how alike readings are at that distance apart. It also says how sure the estimate is: sure near a monitor, less so far away.
Here you attach the readings. Mapstack fits the model, maps the estimate and the uncertainty, and says how it was set up.
One real set of readings
101 monitors, one surface, the counties above 9 µg/m³
The 2025 annual mean of fine particles, PM2.5, at California's monitoring sites, from the US Environmental Protection Agency. Mapstack fetched the state and county boundaries.
- Flagged incomplete
- 14of the monitors, tested next
- The reach
- 200 kmabout how far apart readings still resemble each other
- Over the threshold
- 2counties with most of their area above 9 µg/m³
| Share of county area over the threshold | Share |
|---|---|
| Orange County | 100% |
| Kings County | 66% |
| Los Angeles County, under half | 46% |
It says how the model was set up.
A spherical variogram fitted to all 101 sites, a grid of about 6.8 km clipped to the state, and the estimate in five equal bands. The variogram is the curve of how alike two readings are at a given distance apart.
US Environmental Protection Agency, Air Quality System annual summary, 2025. Boundaries: US Census Bureau. Run on 11 November 2026.
Test how much the picture depends on the samples
Leave out the readings you are unsure of, and compare.
Which to use depends on what the map is for. With more than one surface, say which one a question is about.
Leave out the 14 sites marked incomplete and run it again. How much does the picture change? Which run should I trust?
Without them the variogram reached only about 45 km, so away from a monitor the estimate fell back to the statewide average: rings round each monitor. Mapstack recommended the 101-site surface for showing the pattern, and the 87-site one where readings must meet the regulatory completeness standard.
How it goes
You bring the readings. Mapstack fits the model and draws both surfaces.
Attach the readings and name the method.
Mapstack maps the estimate and the uncertainty.
You get the method in writing.
The step-by-step guide is in the documentation: Estimate a value across a whole area from readings at a few points.
Common questions
What happens to my readings?
It stays in your workspace. Only people with a seat in your workspace can see it. Nothing leaves unless you publish it yourself.
It is not used to train AI. Your data and your conversations are not used to train AI models.
It is still yours. You keep ownership of what you bring in. Delete it and it is removed.
The full answer is in the documentation: Your data, privacy and security.
What does it cost?
Free to start. One seat, for you, with a starter amount of work each month. No card.
This job is on the free seat. Maps, datasets, analysis, your own files and public sharing are all included.
Pay per person for more. A paid seat brings more work each month, and seats for your team.
The prices are on the pricing page.
What do I get?
The estimate. A surface across the area, in bands, with the readings drawn on the same scale.
The uncertainty. The standard error, as a second layer: low near monitors, high far from them.
The set-up. The variogram, its reach, the grid and the classes.
Estimate yours.
Free to start. No card.