
Fire risk scoring and risk targeting
Rank every building by fire risk.
Attach your property roll and your fire incidents. You get every building scored on your own rules, the list to inspect first, and a map that picks them out.
Free to start. No card.
| Fire risk score | Points |
|---|---|
| The top 50 | 7 to 14 |
| Higher | 5 to 7 |
| Middle | 4 |
| Lower | 3 |
| Lowest | 0 to 2 |
Equal scores are ordered by building fires, then other fires, then units.
For whoever decides which buildings get a visit
Fire marshals.Housing inspectors.
There are more buildings than inspectors, so the visits go where a fire would do the most harm.
Fire prevention bureaus call this risk-based inspection, or risk targeting: score every building on what makes a fire likelier or worse, such as its age, its use, its size and the fires it has already had, and visit from the top.
Here you attach the records you already keep and say what each thing is worth. Mapstack matches, scores, ranks and maps.
One real district
Every apartment and mixed-use building in the Mission, ranked
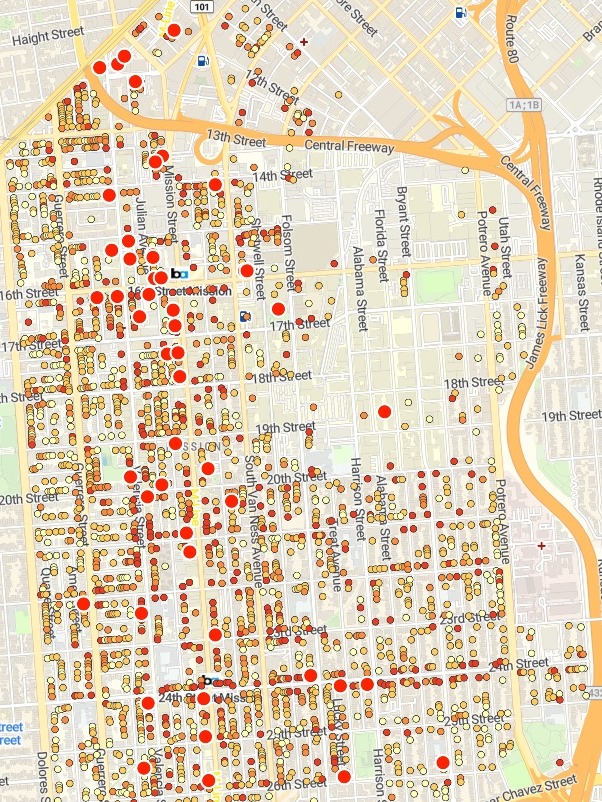
San Francisco's 2025 assessor roll for the Mission District, cut to buildings of three or more units, and the fire department's fires in or on buildings there from 2021 to 2025: building fires, and smaller ones such as contained cooking and trash fires.
- Matched by address
- 350of the 880 fires, at 186 buildings
- The top five
- SROsall residential hotels: single-room occupancy buildings
- First to inspect
- 3buildings tied at the top score of 14
| Top of the list | Score | Fires, building + other |
|---|---|---|
| 2080-2086 Mission St | 14 | 3 + 8 |
| 3040-3052 16th St | 14 | 1 + 12 |
| 418-422 Valencia St | 14 | 0 + 21 |
| 2176-2186 Mission St | 12 | 0 + 4 |
| 30 Sycamore St | 12 | 0 + 4 |
| 1707 Market St | 11 | 2 + 0 |
A fire counts where it happened.
A fire was matched when its street number fell inside a building’s number range on the same street, so the 21 fires reported at 422 Valencia St went to 418-422 Valencia St. Fires at addresses outside the 2,389 buildings on the list were left unmatched and count towards none of them.
City and County of San Francisco, Office of the Assessor-Recorder, secured property tax roll, 2025. San Francisco Fire Department, Fire Incidents, 2021 to 2025. Both from DataSF. Run on 15 November 2026.
From a property roll and a fire log to an inspection list
Columns: Address (its number range and street), Year built (as on the roll), Property class (flats, flat and store, hotel), Units (homes in the building), Stories (its height), Location (latitude and longitude). 2,389 rows. The fires come as a second file: each incident’s date, address, type and location.
What you get
- Each fire on its building, where its address is on the roll, and a count of the rest.
- A score for every building, on the points you set, with a cap where you want one.
- The top 50 in order, with year built, class, units, fires and score.
- A map of every building by score, the top 50 picked out, with search by address.
How it goes
You bring the roll, the fires and your rules.
Attach the roll and the fires and say what each thing scores.
Mapstack scores every building and maps it.
You get how many buildings have each score.
Common questions
What happens to our records?
It stays in your workspace. Only people with a seat in your workspace can see it. Nothing leaves unless you publish it yourself.
It is not used to train AI. Your data and your conversations are not used to train AI models.
It is still yours. You keep ownership of what you bring in. Delete it and it is removed.
The full answer is in the documentation: Your data, privacy and security.
What does it cost?
Free to start. One seat, for you, with a starter amount of work each month. No card.
This job is on the free seat. Maps, datasets, analysis, your own files and public sharing are all included.
Pay per person for more. A paid seat brings more work each month, and seats for your team.
The prices are on the pricing page.
What does the score count?
What you tell it to. Age, use, size and past fires, each band worth the points you give it.
Every building on the roll. Not only those with a fire: age, use and size score on their own.
Each score on the map. Select a building to see its year, class, units, fires and score.
Rank yours.
Free to start. No card.