
A customer map, by neighbourhood
Find where your customers cluster.
Attach your customer or case records and your neighbourhood boundaries. You get a count for each neighbourhood, the busiest and quietest named, and a shaded map.
Free to start. No card.
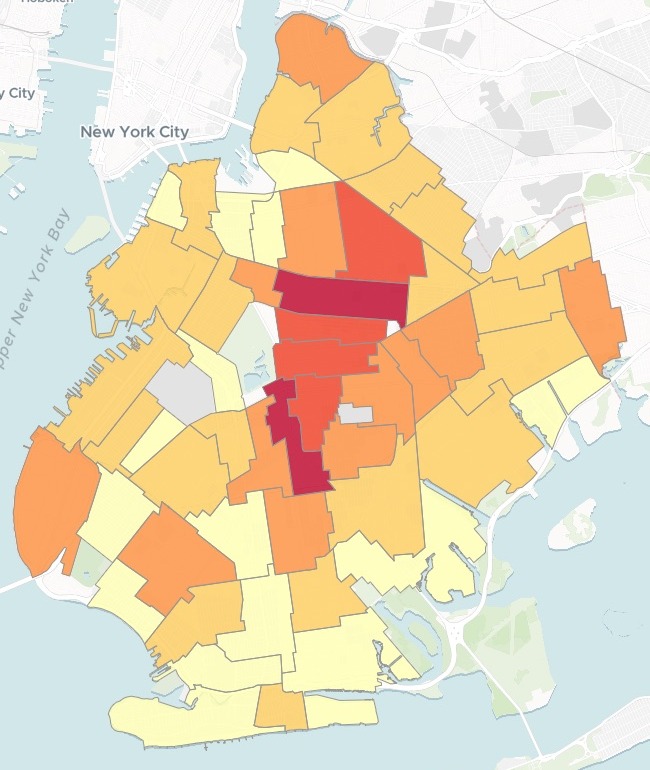
| Complaints per neighbourhood | |
|---|---|
| 568 and above | |
| 344 – 568 | |
| 171 – 344 | |
| 76 – 171 | |
| Below 76 | |
| Parks and cemeteries, left out |
Darkest through Crown Heights (North) and Flatbush; palest along the south shore.
For anyone deciding where to send people
Sales reps, organisers, outreach and support teams.The records say who.
The question is where.
Count every record into the neighbourhood it falls in, shade each neighbourhood by its count, and the busy and quiet parts show at a glance. A map shaded this way is a choropleth.
The example below is a tenant group's, and its records are complaints. Customers, members, patients or cases work the same way: any records with a location.
One real month
A month of heat complaints across Brooklyn
Every heat and hot water complaint Brooklyn residents made to New York City's 311 line in October 2026, with the city's official neighbourhood boundaries. Asked by a tenant outreach group choosing where to send its organisers this winter.
- Busiest
- Flatbushthe most complaints of any neighbourhood
- The busiest stretch
- CentralBrooklyn: Flatbush, Crown Heights, Prospect Lefferts Gardens and Bed-Stuy
- Quietest
- 13complaints in South Williamsburg, the fewest of the neighbourhoods where people live
| The ten busiest | Complaints |
|---|---|
| Flatbush | 653 |
| Crown Heights (North) | 568 |
| Prospect Lefferts Gardens-Wingate | 375 |
| Bedford-Stuyvesant (East) | 367 |
| East Flatbush-Erasmus | 353 |
| Crown Heights (South) | 344 |
| Bay Ridge | 254 |
| Bedford-Stuyvesant (West) | 237 |
| Flatbush (West)-Ditmas Park-Parkville | 237 |
| East Flatbush-Remsen Village | 221 |
Six neighbourhoods stand apart from the rest.
NYC Open Data, 311 Service Requests, heat and hot water, Brooklyn, created 1 to 31 October 2026. NYC Department of City Planning, 2020 Neighborhood Tabulation Areas. Run on 15 November 2026.
From a list of records to a count for every neighbourhood
Columns: Complaint ID (one per complaint), Date (when it was made), Type (heat or hot water), Address and ZIP code (the building), Latitude, longitude (where it is). 7,827 rows. With them, the city's neighbourhood boundaries: one zipped shapefile of all five boroughs.
What you get
- A count for every neighbourhood, inside the boundaries you attached.
- The ten busiest and the ten quietest, each with its official code.
- A shaded map: five shades, split where the counts fall naturally apart (natural breaks), darkest where the records are thickest.
How it goes
Attach both files and ask in a sentence.
Mapstack counts every record and shades each neighbourhood.
Your team works from the map.
Common questions
What happens to our customer records?
It stays in your workspace. Only people with a seat in your workspace can see it. Nothing leaves unless you publish it yourself.
It is not used to train AI. Your data and your conversations are not used to train AI models.
It is still yours. You keep ownership of what you bring in. Delete it and it is removed.
The full answer is in the documentation: Your data, privacy and security.
What does it cost?
Free to start. One seat, for you, with a starter amount of work each month. No card.
This job is on the free seat. Maps, datasets, analysis, your own files and public sharing are all included.
Pay per person for more. A paid seat brings more work each month, and seats for your team.
The prices are on the pricing page.
Which areas can it count by?
Your own boundaries. Neighbourhoods, districts, wards or sales territories, as a file you attach.
Part of a bigger file. Attach a whole city or region and say which part to use.
Only the areas you want. Name the kinds to leave out, as the example left out parks and cemeteries.
Map yours.
Free to start. No card.