
Next month's report, the same way
Re-run last month's analysis on new figures.
Do the analysis once. Next month, attach the new file and ask for the same again. You get the same method, a new map, and the areas that moved most.
Free to start. No card.
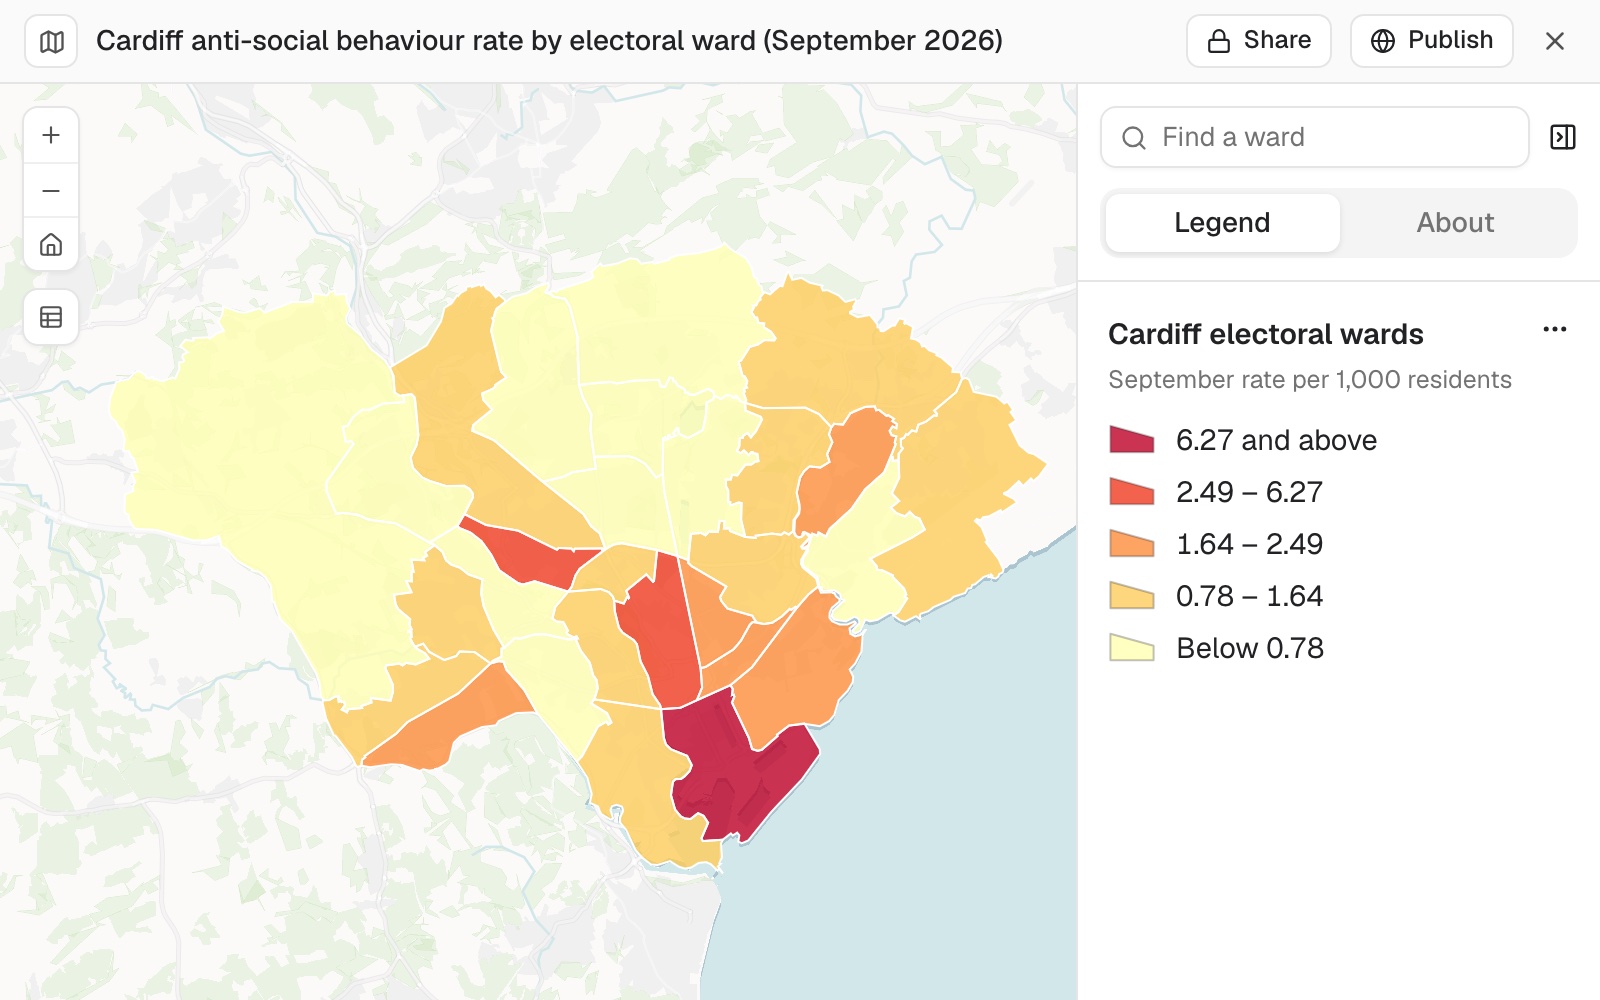
| September | |
|---|---|
| Electoral wards | 28 |
| Butetown, per 1,000 residents | 6.27 |
| Crime records this month | 4,013 |
Pontprennau and Old St Mellons fell most, from third to tenth.
For whoever writes the same monthly report
Community safety.Performance teams.A consultant with a standing client report.The method was settled months ago.
The work is doing it again, exactly.
Done by hand, each month is a chance to do it slightly differently.
Here you check the first month carefully. After that, the new file is the only thing that changes.
Two real months
August, then September, the same method twice
Street-level crime from police.uk for the area around Cardiff. Anti-social behaviour by electoral ward, per 1,000 residents, from Census 2021 population.
- August
- 4,563crime records; Butetown first for anti-social behaviour
- September
- 4,013crime records, run the same way
- Still first
- 6.27per 1,000 in Butetown in September
| Per 1,000 residents | Rate | Rank |
|---|---|---|
| Butetown, Aug | 5.11 | 1st |
| Butetown, Sep | 6.27 | 1st |
| Pontprennau, Aug | 2.73 | 3rd |
| Pontprennau, Sep | 1.28 | 10th |
It reuses the areas and the population from last time.
Each ward gets its new rate, last month's, the change and the change in rank. The new month has its own map, and one dataset holds both months.
police.uk street-level crime, August and September 2026. Population: Census 2021, Cardiff electoral wards. Run on 11 November 2026.
How it goes
Once carefully, then the same again each month.
Do the first month and check it.
Next month, attach the new file and ask for the same again.
You get what changed.
The step-by-step guide is in the documentation: Re-run last month's analysis on this month's figures.
Common questions
What happens to my files?
It stays in your workspace. Only people with a seat in your workspace can see it. Nothing leaves unless you publish it yourself.
It is not used to train AI. Your data and your conversations are not used to train AI models.
It is still yours. You keep ownership of what you bring in. Delete it and it is removed.
The full answer is in the documentation: Your data, privacy and security.
What does it cost?
Free to start. One seat, for you, with a starter amount of work each month. No card.
This job is on the free seat. Maps, datasets, analysis, your own files and public sharing are all included.
Pay per person for more. A paid seat brings more work each month, and seats for your team.
The prices are on the pricing page.
What stays the same?
The method. The same steps, the same areas, the same population.
Last month's work. Its map and datasets are left as they were.
Each step, kept. Every step is a dataset you can open and check.
The colours, if you ask. Ask for the same class breaks every month, so a colour always means the same rate.
Run yours.
Free to start. No card.