
Elevation as shaded relief
See the lie of the land under your boundaries.
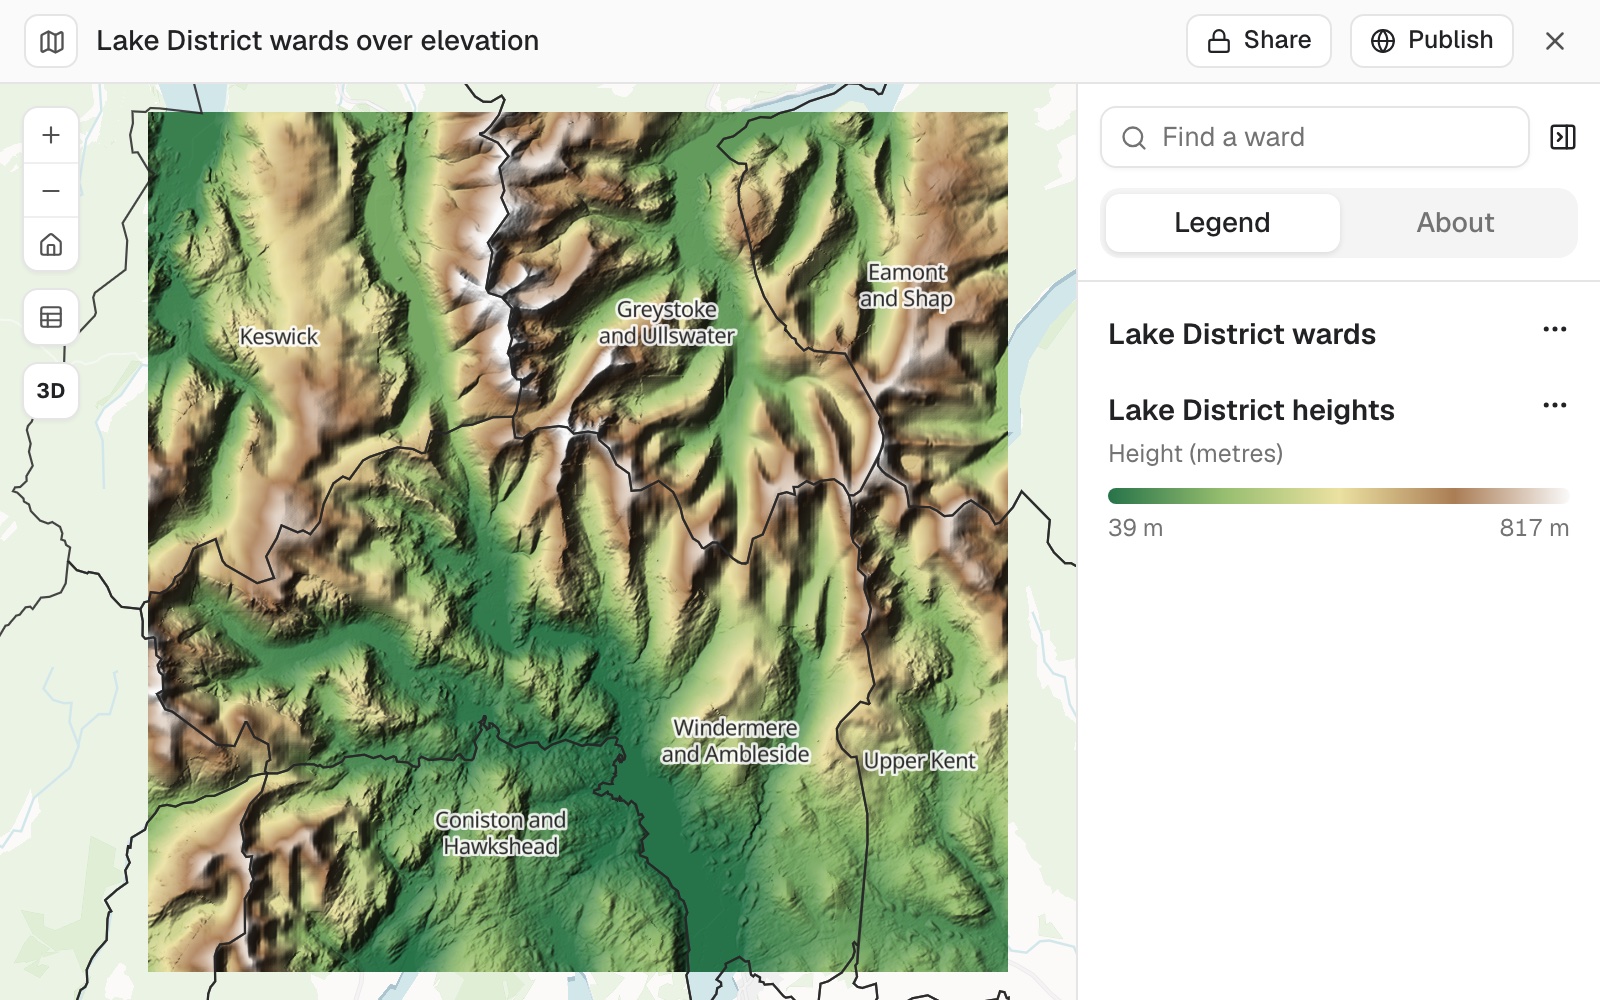
Bring in a digital elevation model (DEM) of your area. You get shaded relief with an elevation colour ramp, and your boundaries drawn on top.
Elevation files are on a paid seat.
| Heights in the file | |
|---|---|
| Highest, on Helvellyn | 949 m |
| Lowest, at the head of Windermere | 38 m |
| Pixel size | 22 m |
The key is in metres, and the map switches to 3D.
For planners, drainage officers and estate managers
The boundaries are flat lines on a flat map.The ground under them is not.
Where the water goes, what can be seen from where, what is easy to reach.
Setting the scene for a report usually means a hillshade made in desktop GIS and a screenshot.
Here the elevation file goes in as it is. Boundaries you have brought in before, or official ones Mapstack fetches, go on top.
One real elevation model
From 38 m to 949 m, coloured where the land is
An elevation model of the central Lake District, from Windermere up to Helvellyn: a GeoTIFF of 1,024 by 1,024 pixels. On top, the area's electoral wards from the library.
- The file
- 1,024²pixels, each about 22 m across
- Covered
- 514 km²from Windermere to Helvellyn
- The colours stop at
- 817 mfrom 39 m, so they spread across the land
| Heights, metres | Metres |
|---|---|
| Highest in the file, on Helvellyn | 949 |
| Where the colour ramp stops | 817 |
The colours are stretched over all but the very lowest and highest heights.
That way they spread across the land instead of being spent on a few summits. The key gives the range the colours cover, in metres.
Elevation model of the central Lake District. Boundaries: Office for National Statistics, electoral wards, December 2025. Run on 10 November 2026.
It says what the file does not
Where a file leaves something unstated, such as the units of its heights, Mapstack says so.
The elevation file's facts are on its Details tab in your library.
What are the vertical units, and how do you know?
Metres, here. Mapstack says where its answer comes from: the file itself, the published specification of the source, or you. Tell it what you know, and that is what it uses.
How it goes
You bring the elevation file. The boundaries come from your library, or Mapstack fetches them.
Attach the elevation model and name the boundaries.
Mapstack draws it, with a switch to 3D.
You get the heights and the units.
The step-by-step guide is in the documentation: Show an elevation model as shaded relief under your boundaries.
Common questions
What does it cost?
Elevation files are on a paid seat. Paid seats are per person, and bring more work each month.
Free to look around. Maps, datasets and analysis are on the free seat. No card.
The prices are on the pricing page.
What happens to my file?
It stays in your workspace. Only people with a seat in your workspace can see it. Nothing leaves unless you publish it yourself.
It is not used to train AI. Your data and your conversations are not used to train AI models.
It is still yours. You keep ownership of what you bring in. Delete it and it is removed.
The full answer is in the documentation: Your data, privacy and security.
Show yours.
Elevation files are on a paid seat.