
A commuting flow map
See where people commute, county to county.
Attach a table of who travels from where to where. You get a map with a line for every flow, thicker for more people.
Free to start. Reports and prints on a paid seat.
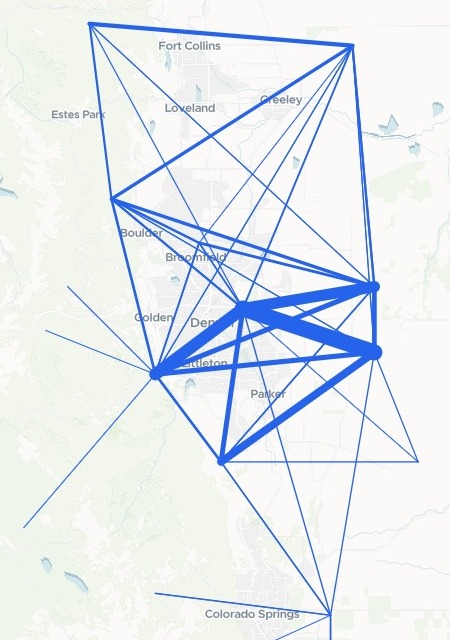
| Commuting between counties | |
|---|---|
| A flow of 1,000 workers or more, thicker for more |
The thickest lines run between the counties of the Denver area.
For whoever plans around the commute
The table says how many people travel between each pair of places.
The plan has to show it.
A table with a row for each place people leave and each place they go is an origin-destination table. Drawn as straight lines between the two, sized by the number of people, it is a flow map, and planners call the lines desire lines.
You give each row a point for both ends and say which flows to leave out. The lines, the rankings and the sums are done for you.
From one row per pair to one line per flow
Columns: Home county (where the workers live), Home point (latitude and longitude), Work county (where they work), Work point (latitude and longitude), Workers (how many make that commute), Margin of error (how far out it may be). 849 rows. One row for each home county and work county, as the Census Bureau publishes them, with a centre point added for each end.
What goes on the map
- A line for every flow you keep, thicker for more workers.
- Same-county commutes and small flows left out, at the threshold you set.
- Each line opens to its home county, work county, workers and margin of error.
One real state
Who pulls commuters in, and who sends them out
The Census Bureau's county-to-county commuting flows for people who live and work in Colorado, from the American Community Survey, 2016 to 2020, with each county's centre point added from the Bureau's county gazetteer.
- Cross a county line
- 32.12%of Colorado's workers: nearly one in three
- Biggest net sender
- Adams54,607 more workers leave the county for work than come in
- The magnet
- Denver145,406 more workers come in than go out
| Home county to work county | Workers | Margin of error |
|---|---|---|
| Arapahoe to Denver | 93,396 | ±2,127 |
| Jefferson to Denver | 69,713 | ±1,872 |
| Adams to Denver | 64,325 | ±2,073 |
| Denver to Arapahoe | 52,427 | ±1,795 |
| Douglas to Arapahoe | 42,521 | ±1,327 |
It adds what a planner asks next.
Beside each county's in, out and net commuting, it gave the jobs filled there and the share of its own workers who leave: 63.51% in Broomfield, 58.04% in Adams.
US Census Bureau, Residence County to Workplace County Commuting Flows, 5-year American Community Survey 2016-2020; 2020 Gazetteer Files, counties. Downloaded, attached and run on 15 November 2026.
How it goes
Attach the flows table and say what to leave out.
Mapstack draws every flow on one map.
You get the figures with it.
Take it into the plan
The same flows go on to the people who need them.
Write it up
Background for a long-range plan.
- Write a briefing report on these commuting flows for our long-range transportation plan.
Print it
For a meeting, a wall or an appendix.
- Make a printable map of the commuting flows.
Common questions
What happens to our flows table?
It stays in your workspace. Only people with a seat in your workspace can see it. Nothing leaves unless you publish it yourself.
It is not used to train AI. Your data and your conversations are not used to train AI models.
It is still yours. You keep ownership of what you bring in. Delete it and it is removed.
The full answer is in the documentation: Your data, privacy and security.
What does it cost?
Free to start. One seat, for you, with a starter amount of work each month. No card.
The flow map and the figures are on the free seat. With your own files and public sharing.
Briefing reports and printable maps are on a paid seat. Paid seats are per person, and bring more work each month.
The prices are on the pricing page.
What else is on the map?
Search. Find any home or work county by name.
A chart. Workers by the county they work in.
Map your flows.
Free to start. Reports and prints on a paid seat.