
Which area is each place in
Add the area to every row of your list.
Give Mapstack a list of places. You get the official area for each one, the ones outside flagged, and your list back with the new columns.
Free to start. No card.
| Of 1,522 stations | Stations |
|---|---|
| Inside the 20 arrondissements | 1,000 |
| Outside Paris, in four departments | 522 |
Each row inside now carries its arrondissement's code and name.
For anyone who has to report by area
Which district each site is in.How many in each.How many per head.Which districts are best and worst served.
The list has none of it.
Checking each place against a set of areas is called a spatial join. It turns a list of places into a report by area.
You bring the list, with coordinates or with addresses. Mapstack fetches the boundaries and the population, and shows its counts. Reporting by areas of your own? Attach them too.
One real list
1,522 stations, 20 arrondissements, 522 outside
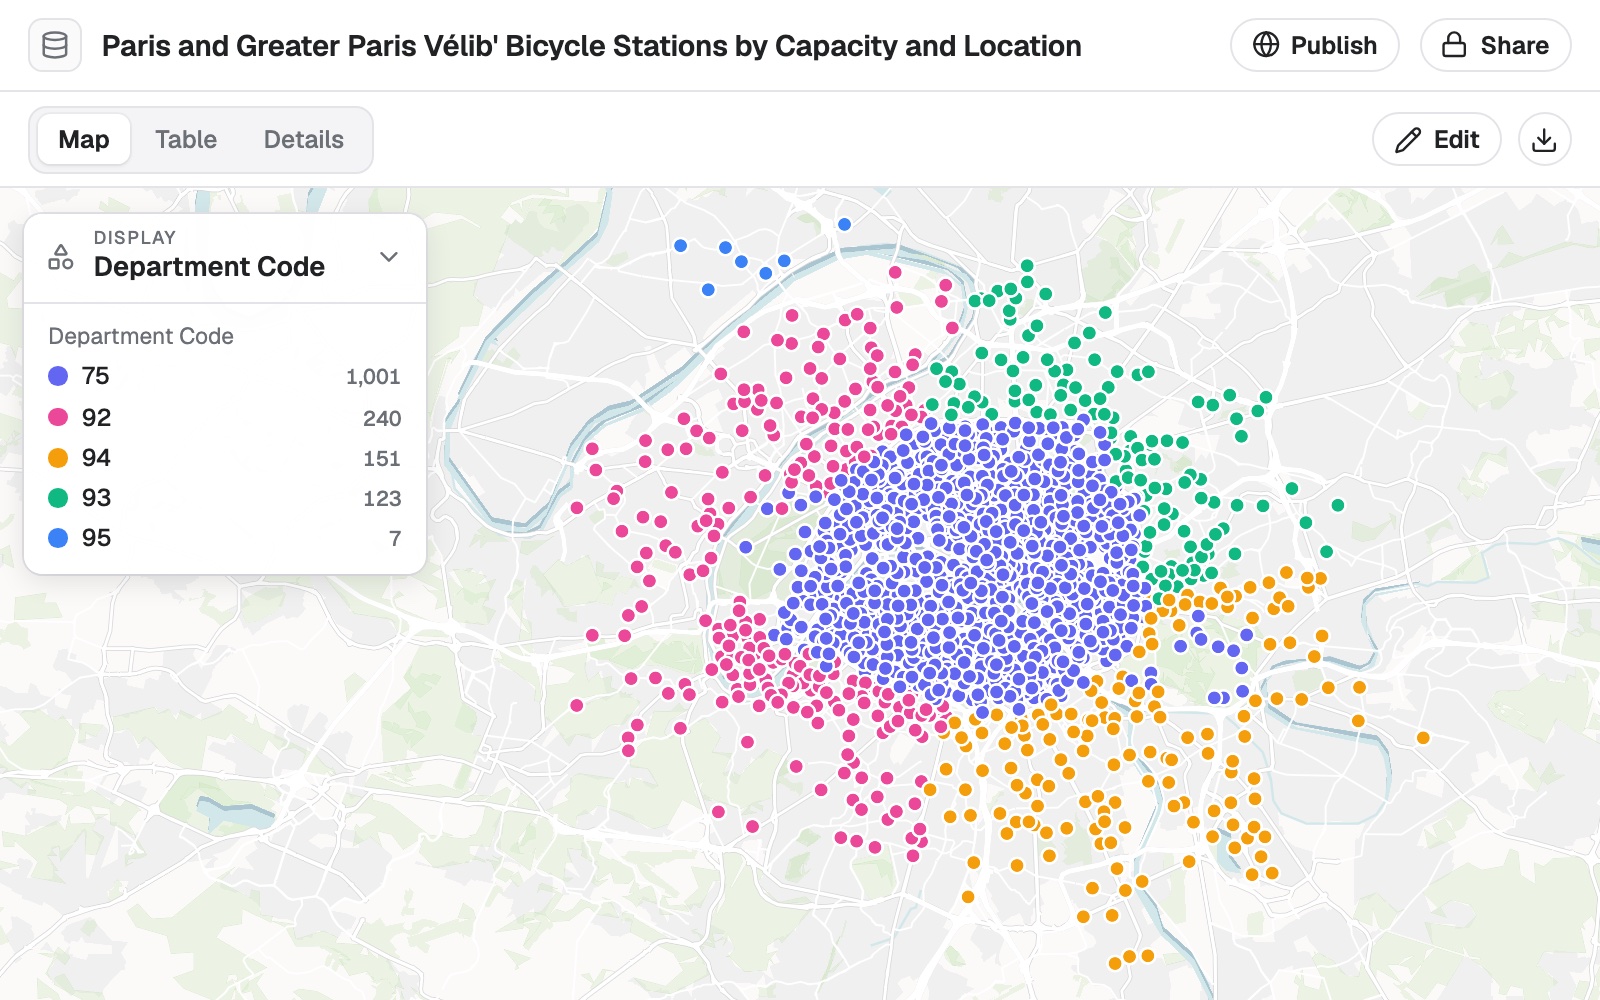
The City of Paris's open list of Vélib' bike-share stations. About a third are in the towns around Paris, not in the city.
- Inside
- 1,000stations, each with its arrondissement added
- Outside
- 522stations flagged as outside Paris
- Most in one
- 89stations in the 15th arrondissement, and 15 in the 3rd
| Stations by department | Stations |
|---|---|
| Paris, the 20 arrondissements | 1,000 |
| Hauts-de-Seine | 240 |
| Val-de-Marne | 151 |
| Seine-Saint-Denis | 123 |
| Val-d'Oise | 7 |
It flags the rows outside, and then says where they are.
Asked about the 522 outside Paris, Mapstack fetched the next set of areas out and answered by department and commune.
City of Paris open data, Vélib' stations. Population: INSEE, 2023 census. Run on 11 November 2026.
Turn counts into a fair comparison
A count mostly follows size. A rate per resident compares areas fairly.
Small central areas with few residents and many visitors run high. Read a ranking with that in mind.
Now stations per 10,000 residents by arrondissement, using the latest official population. Which five are best and worst served? Say which population year you used.
Mapstack fetched the population for the same areas and said it was the 2023 census. The 1st had the most stations per 10,000 residents, 17.86, and the 18th the fewest, 3.39. It added that ranking by docks gives a different top five, because stations differ in size.
How it goes
You bring the list. Mapstack brings the areas, the population and the arithmetic.
Attach your list and name the areas you report by.
Mapstack places every row and finds the area it is in.
You get the counts, and your list back.
The step-by-step guide is in the documentation: Add the area to every row of your list, then count and rank by area.
Common questions
What happens to my list?
It stays in your workspace. Only people with a seat in your workspace can see it. Nothing leaves unless you publish it yourself.
It is not used to train AI. Your data and your conversations are not used to train AI models.
It is still yours. You keep ownership of what you bring in. Delete it and it is removed.
The full answer is in the documentation: Your data, privacy and security.
What does it cost?
Free to start. One seat, for you, with a starter amount of work each month. No card.
This job is on the free seat. Maps, datasets, analysis, your own files and public sharing are all included.
Pay per person for more. A paid seat brings more work each month, and seats for your team.
The prices are on the pricing page.
What do I get back?
Your own list, row for row. Every original row and column is kept.
The area on every row. Its code, its name, and an inside or outside flag.
A file to take away. Download it for your spreadsheet or your GIS.
Sort yours.
Free to start. No card.