
Before an environmental monitoring plan
See which gauges already measure your river.
Attach your river's catchments. You get the active gauging stations, rain gauges and boreholes inside them from open data, on one map.
Free to start. Reports and prints on a paid seat.
| Active stations in the catchment | Count |
|---|---|
| Groundwater level boreholes | 35 |
| Rain gauges | 3 |
| River flow gauges | 2 |
| River level gauge | 1 |
| Flow and level gauge | 1 |
| Water bodies with none | 3 of 10 |
Stations the Environment Agency lists as closed are left out.
For whoever writes the monitoring plan
Rivers trusts, catchment groups and consultants.
Before you decide what to measure, you need to know which stations are already there.
A water body is the unit a river is reported by under the Water Framework Directive: a stretch of river and the land that drains into it. Flow and level gauges, rain gauges and groundwater boreholes together make up the hydrometric network, the stations that measure how much water there is.
One real catchment
The River Wensum, water body by water body
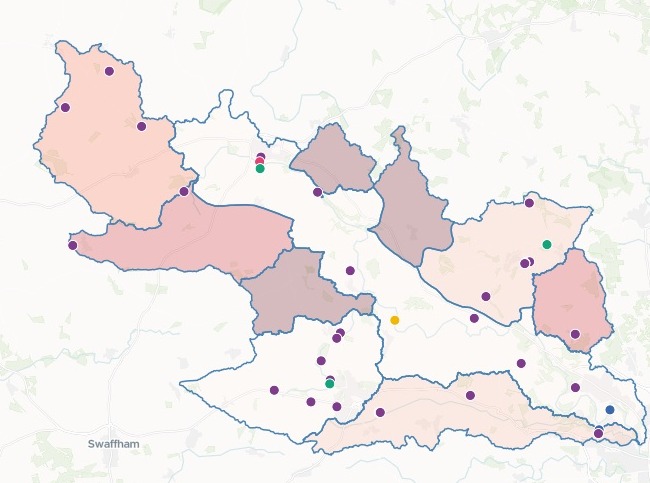
The ten water bodies of the Wensum, a chalk river in Norfolk, from the Environment Agency's Catchment Data Explorer. Mapstack fetched the stations from the Agency's hydrology service itself.
- The gaps
- 3 of 10water bodies with no flow, level, rainfall or groundwater station
- On the river
- 2 of 10water bodies with a flow or level gauge: the Tud and Wensum US Norwich
- Most stations
- 12in Wendling Beck, nearly all of them groundwater boreholes
| Water body | Active stations |
|---|---|
| Wendling Beck | 12 |
| Wensum US Norwich | 10 |
| Blackwater Drain (Wensum) | 8 |
| Tud | 6 |
| Tat | 3 |
| Wensum (to Tatterford) | 2 |
| Swannington Beck | 1 |
| Blackwater (Wendling Beck) | 0 |
| Foulsham Tributary | 0 |
| Little Ryburgh Tributary | 0 |
Boreholes are not river gauges.
Three more water bodies, the Tat, Swannington Beck and the Wensum to Tatterford, have groundwater boreholes and no flow, level or rain gauge.
Environment Agency, Catchment Data Explorer, Wensum Operational Catchment, river water body catchments (Water Framework Directive cycle 3), and the Environment Agency Hydrology service. Both Open Government Licence v3.0. Run on 15 November 2026.
How it goes
You bring the water bodies. Mapstack brings the stations.
Attach your water bodies and name the kinds of station.
Mapstack finds the stations in open data and places each in its water body.
You get the map and the table.
Go further
The same catchment, taken on to the plan.
What else to draw on
Ask what other open data covers the river.
- Which other open datasets cover our river that a monitoring plan should use?
Your own sites
Put what you measure beside what the Agency measures.
- Attached: the sites we already survey ourselves. Add them to the map and the table, and tell me which water bodies have neither one of our sites nor one of these stations.
For the steering group
Put it in front of the people who decide.
- Draft a monitoring report for the steering group from these findings.
- Make an A4 print map of the catchment and its stations.
Common questions
What happens to our catchment files?
It stays in your workspace. Only people with a seat in your workspace can see it. Nothing leaves unless you publish it yourself.
It is not used to train AI. Your data and your conversations are not used to train AI models.
It is still yours. You keep ownership of what you bring in. Delete it and it is removed.
The full answer is in the documentation: Your data, privacy and security.
What does it cost?
Free to start. One seat, for you, with a starter amount of work each month. No card.
The map, the counts and the table are on the free seat. With your own files and public sharing.
A written report or a print map is on a paid seat. Paid seats are per person, and bring more work each month.
The prices are on the pricing page.
Where do the stations come from?
Open data, fetched for you. Mapstack found the Environment Agency's hydrology stations itself. You attach only your water bodies.
Each one with its details. Select a station for its name, reference and what it measures.
Your boundaries as downloaded. The zipped shapefile went in as it came from the Catchment Data Explorer.
Map yours.
Free to start. Reports and prints on a paid seat.