
Performance by region and territory
Map your performance by region.
Attach your results by area for this year and last. You get each area shaded by its rate against target, the change from last year, and the strongest and weakest.
Free to start. No card.
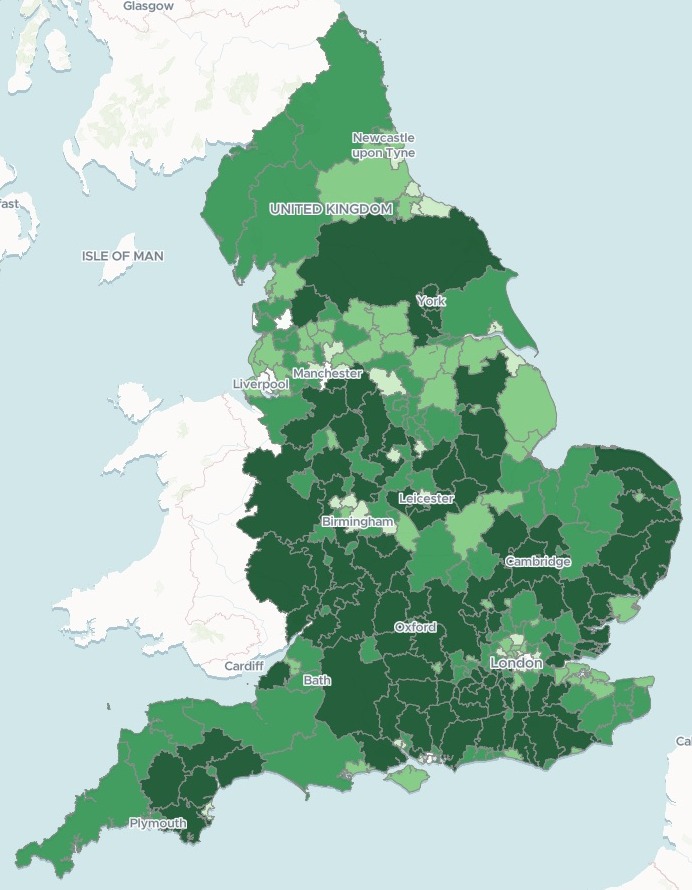
| Collected in 2024-25 | Rate |
|---|---|
| Highest, Surrey Heath | 99.49% |
| Lowest, Liverpool | 86.83% |
| England overall | 95.88% |
Five of the ten weakest councils are in the North West.
For anyone who reports results by area
Sales by territory.Takings by branch.Results by region.The figures are in a spreadsheet.
Where you are strong and where you are slipping is not.
A map shaded by each area's figure is called a choropleth. Shaded once by the rate against target and again by the change from last year, it shows the weak areas and the ones getting weaker. Any KPI set against a target works the same way.
Here you bring the table. Mapstack finds the boundaries, shades the areas and ranks them.
From a table of results to a map of them
Columns: Authority (the area’s name), ONS Code (its official code), Region (the region it sits in), Estimate of amount collectable (the target, each year), Amount collected (the actual, each year). 296 rows. One row for each area, two years side by side, and no shapes.
What you get
- The official boundaries, found and matched on the code.
- A map of every area, shaded by this year’s rate, with the change from last year one switch away.
- The ranking: the ten strongest, the ten weakest, and how many rose and fell.
- Each area’s figures: target, actual, both rates and the change, when someone selects it.
One real table, standing in for yours
More councils slipped than improved
The government’s published council tax collection for every council in England, 2023-24 and 2024-25. Each council stands in for a territory: the tax due is the target, the tax collected the takings. Mapstack fetched the official council boundaries itself.
- Fell
- 166councils collected a smaller share than the year before; 122 rose
- Weakest region
- 94.27%the North West, everything collected over everything due
- Strongest region
- 97.14%the East of England, the same as the year before
| The biggest falls | Percentage points |
|---|---|
| Torbay | −2.67 |
| East Staffordshire | −1.79 |
| Enfield | −1.62 |
| Haringey | −1.14 |
Regions are worked out from their totals.
Each region’s rate is everything it collected over everything due, not an average of its councils’ rates, so a big council counts for more than a small one.
Ministry of Housing, Communities and Local Government, collection rates for council tax and non-domestic rates in England, 2024 to 2025, Table 6a (Open Government Licence). Boundaries: local authority districts, December 2023, fetched by Mapstack. Run on 15 November 2026.
How it goes
You bring the table. Mapstack brings the boundaries.
Attach your results by area and say what to shade.
Mapstack maps every area and adds the change view.
You get the ranking. Here, the next weakest after Liverpool.
Common questions
What happens to our figures?
It stays in your workspace. Only people with a seat in your workspace can see it. Nothing leaves unless you publish it yourself.
It is not used to train AI. Your data and your conversations are not used to train AI models.
It is still yours. You keep ownership of what you bring in. Delete it and it is removed.
The full answer is in the documentation: Your data, privacy and security.
What does it cost?
Free to start. One seat, for you, with a starter amount of work each month. No card.
This job is on the free seat. Maps, datasets, analysis, your own files and public sharing are all included.
Pay per person for more. A paid seat brings more work each month, and seats for your team.
The prices are on the pricing page.
How does the team find the weak areas?
A filter for the line. Show only the areas below the overall rate, or only those above it.
Filters by region and type. Narrow the map to one region, or one type of area.
A search by name. Find any area by typing its name.
Map yours.
Free to start. No card.