
Shapefile to web map
Turn a shapefile into a web map anyone can open.
Attach the zip as it comes out of QGIS or ArcGIS. You get a styled web map with popups, a legend and a table, to publish at a link.
Free to start. No card.
| The file | Count |
|---|---|
| Zones | 2,807 |
| Zoning objectives | 18 |
| Shapes repaired | 9 |
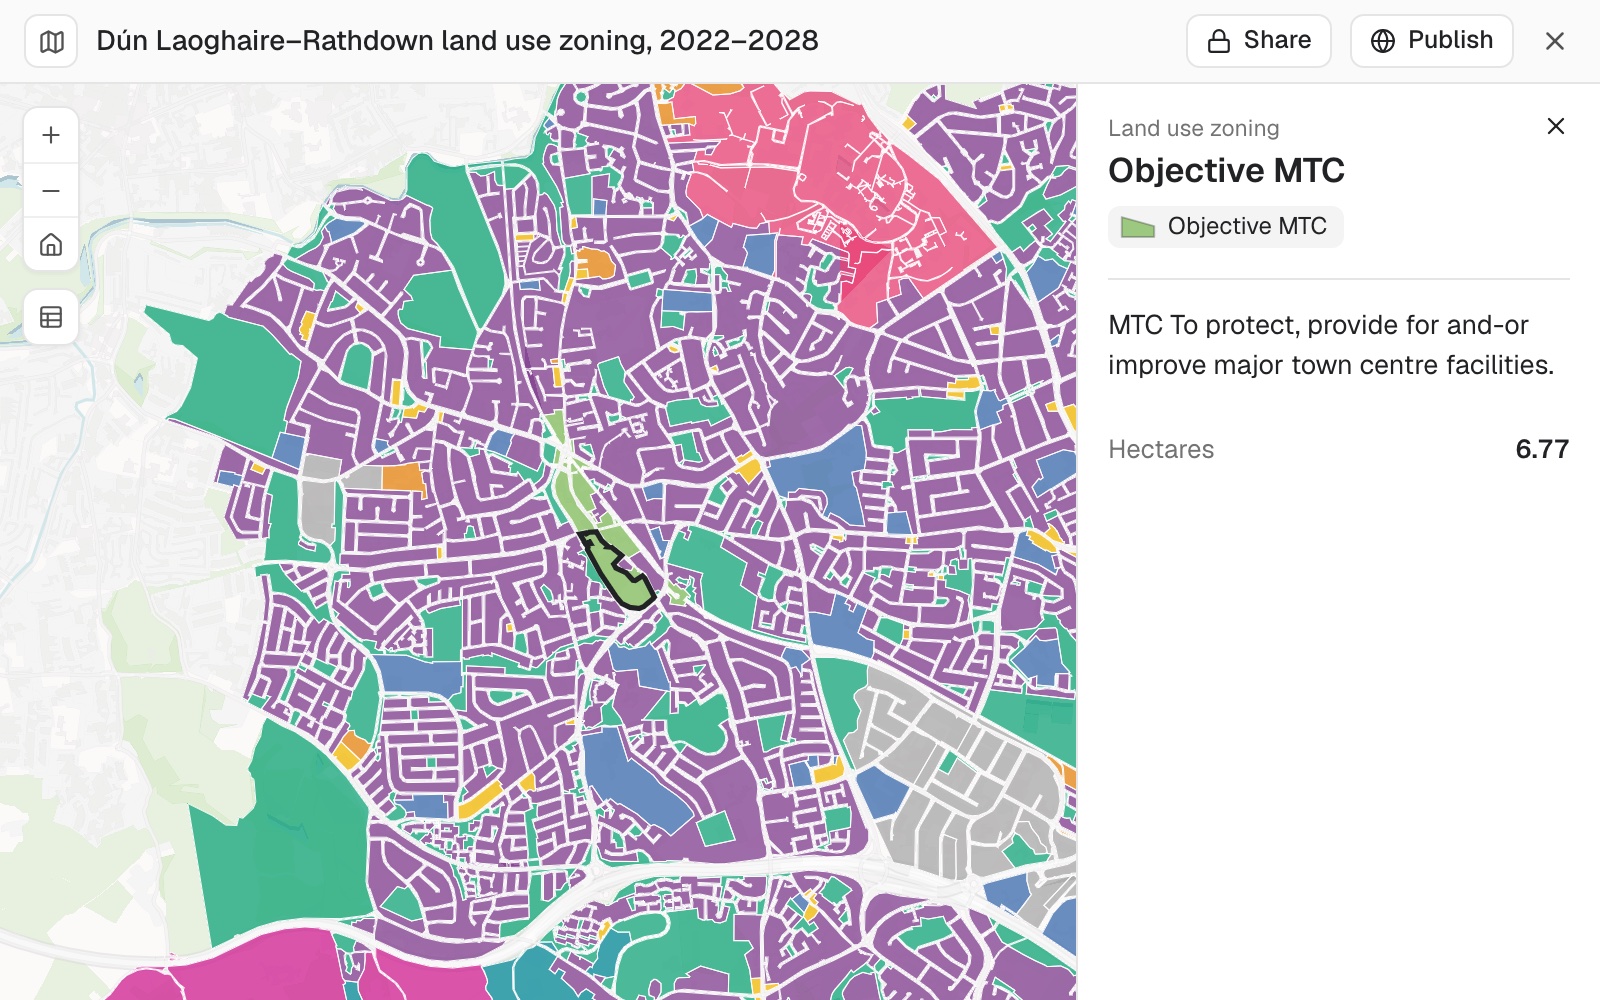
Selected: Objective MTC, major town centre facilities, 6.77 hectares.
From a zip to a link
Columns: ZoningObje (the zoning objective), ObjectiveD (the objective's wording), Hectares (the area). 2,807 rows. Irish Transverse Mercator, declared in the .prj.
What you get
- A dataset in your workspace: its record count, shape type and coordinate system, and how that was settled.
- Every fix listed, with a count: shapes repaired, fields renamed, garbled text recovered.
- A styled map with popups, a legend and a table.
- A link: private to you until you publish it for anyone to open.
For whoever holds the file
The data is in a shapefile on your drive.The people who need it have a browser.
Getting from one to the other should not take a web developer.
The usual routes are a hosted GIS account with its own publishing steps, or exporting tiles and writing the page yourself.
This reads the file as it comes, and gives you a map with a link.
Make it read for your readers
A shapefile holds at most ten characters in a field name. Your readers need not see them.
An exact instruction is done without a proposal first.
Anything you do not mention stays as it was.
Call ZoningObje "Zoning objective" in the legend and the popup, and add a filter so readers can pick one or more zoning objectives.
The map changes in place. The file's own names stay in the dataset.
How it goes
You say how it should look. Mapstack does the reading, the reprojecting and the styling.
Attach the zip and say how to colour it.
Mapstack reads it and settles the coordinate system.
You style it, then publish it at a public link.
The step-by-step guide is in the documentation: Turn a shapefile into a web map.
A coloured map is where it starts
Ask for changes in plain words. Each of these is something you can ask for today.
Style
By category, by number, in 3D.
- Colour the zones by GZTCategor, the generalised zoning type, instead.
- Only show zones where Hectares is greater than 1.
- Extrude the buildings by their height field.
Popups and filters
What a reader sees and can change.
- Add the Link field to the popup as a link to the plan chapter.
- Add a filter so readers can pick one or more zoning objectives.
Other files
The same request, whatever the format.
- Make a web map from this GeoPackage.
- Do the same with this GeoJSON.
Common questions
What happens to my file?
It stays in your workspace. Only people with a seat in your workspace can see it. Nothing leaves unless you publish it yourself.
It is not used to train AI. Your data and your conversations are not used to train AI models.
It is still yours. You keep ownership of what you bring in. Delete it and it is removed.
The full answer is in the documentation: Your data, privacy and security.
What does it cost?
Free to start. One seat, for you, with a starter amount of work each month. No card.
This job is on the free seat. Maps, datasets, analysis, your own files and public sharing are all included.
Pay per person for more. A paid seat brings more work each month, and seats for your team.
The prices are on the pricing page.
What does it do with the file?
Reads it as it comes. The .shp, .shx and .dbf, with the .prj and the .cpg beside them.
Settles the coordinate system. From the .prj where there is one. It asks only when the choice is yours.
Repairs and reports. Invalid shapes, unusable field names and garbled text are fixed, each with a count.
Keeps your names. The file's own field names stay in the dataset.
Publish yours.
Free to start. No card.