
Map greenhouse gas emission sources
See where your emissions come from.
Attach your greenhouse gas inventory and satellite plume detections. You get the facilities and the plumes on one map, and which plumes sit near a reporting facility.
Free to start. Written reports on a paid seat.
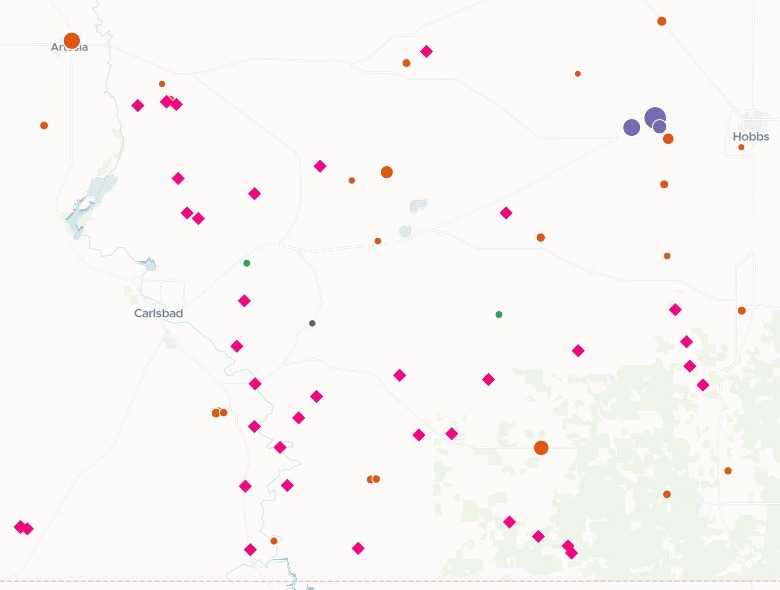
| All of New Mexico, 2023 reporting | |
|---|---|
| Oil and gas | 45 facilities |
| Power plants | 16 facilities |
| Everything else | 12 facilities |
| Landfills | 11 facilities |
| Methane plumes, from satellite | Aug 2022 to Oct 2024 |
Each circle is a reporting facility, sized by its 2023 emissions; each diamond is a plume NASA detected. Shown here: the Permian Basin, in the south-east.
For whoever writes the emissions briefing
Air quality teams.Climate officers.Researchers.
Your briefing needs what facilities report and what the satellite sees.
Reported emissions come in tonnes of CO2-equivalent: each gas weighted by how much it warms the planet, so methane and carbon dioxide add up on one scale.
Here you attach the facility emissions inventory and the plume detections. Mapstack totals and ranks the facilities, matches each plume to the facilities around it, and lists the ones with none nearby.
One real state
Where New Mexico's reported emissions come from
The US EPA's Greenhouse Gas Reporting Program for 2023, its list of direct emitters: the large facilities in New Mexico that report from one site, with their sector and their carbon dioxide, methane and nitrous oxide. Oil and gas production and gathering report by basin, on lists of their own, and were not attached.
- Reported
- 20,889,136tonnes of CO2-equivalent from these facilities in 2023, carbon dioxide 94.73% of it
- Power plants
- 66%of the total; Four Corners Steam Electric Station alone reported 7,185,334 tonnes
- Methane
- 8 of 10of the biggest methane emitters are landfills
| The ten biggest methane emitters | Methane |
|---|---|
| Cerro Colorado Landfill, Bernalillo | 219,028 |
| Sandoval County Landfill | 87,788 |
| Camino Real Landfill, Doña Ana | 82,040 |
| Caja del Rio Landfill, Santa Fe | 50,016 |
| Clovis Regional Solid Waste Facility, Curry | 46,712 |
| Sand Point Landfill, Eddy | 44,933 |
| Lea County Landfill | 44,896 |
| Otero/Greentree Regional Landfill, Otero | 35,039 |
| Chaco Gas Plant, San Juan | 31,937 |
| Station #5 Thoreau Compressor Station, McKinley | 27,690 |
Methane tells a different story from the total.
Among these facilities, landfills are 3.17% of the total but over two-thirds of the methane. Every figure is in tonnes of CO2-equivalent, every facility named with its county.
US Environmental Protection Agency, Greenhouse Gas Reporting Program, 2023 data summary, direct emitters in New Mexico (data as of 16 August 2024). Downloaded and attached on 15 November 2026, and run the same day.
What the satellite saw
41 methane plumes, and what sits under them
Methane plumes NASA's EMIT instrument on the International Space Station detected over New Mexico, August 2022 to October 2024, set against the same facilities. Mapstack fetched the county boundaries itself.
- Near a facility
- 9plumes within 5 km of a reporting facility, matched to 7 facilities with the distance to each
- None near
- 32plumes with no reporting facility within 5 km
- Where they are
- Eddy and Leacounties hold 30 of the 32: the Permian Basin oil and gas fields
- Within 5 km of a reporting facility
- 9
- None within 5 km, in Eddy and Lea counties
- 30
- None within 5 km, elsewhere
- 2
It writes the plain reading.
The inventory points at landfills; the plumes point at the oil fields of the south-east. Wells and gathering lines report by basin, not by site, and are not on the facility list, so no facility row sits under most plumes.
NASA JPL / LP DAAC, EMIT L2B Estimated Methane Plume Complexes 60 m, version 2, plumes centred in New Mexico, August 2022 to October 2024. County boundaries: fetched by Mapstack. Run on 15 November 2026.
How it goes
Attach the inventory and the plumes in one message.
Mapstack maps both, the plumes on top.
Each plume is matched to the facilities near it, with the distance.
Common questions
What happens to our inventory?
It stays in your workspace. Only people with a seat in your workspace can see it. Nothing leaves unless you publish it yourself.
It is not used to train AI. Your data and your conversations are not used to train AI models.
It is still yours. You keep ownership of what you bring in. Delete it and it is removed.
The full answer is in the documentation: Your data, privacy and security.
What does it cost?
Free to start. One seat, for you, with a starter amount of work each month. No card.
The map, the totals and the plume matching are on the free seat. With your own files and public sharing.
A written briefing report is on a paid seat. Paid seats are per person, and bring more work each month.
The prices are on the pricing page.
What does it work out?
Totals your way. Split by gas and by the sector groups you name, each with its number of facilities.
Plumes against facilities. Every reporting facility within the distance you set of each plume, and how far.
The county of each. It fetches the county boundaries itself and places every plume in one.
Map your sources.
Free to start. Written reports on a paid seat.