
A base data package for a place
Get every base layer for a place on one map.
Name the place and the layers you need. You get them all on one map to share, with the source and release of each layer listed.
Free to start. Seats for your team are paid.
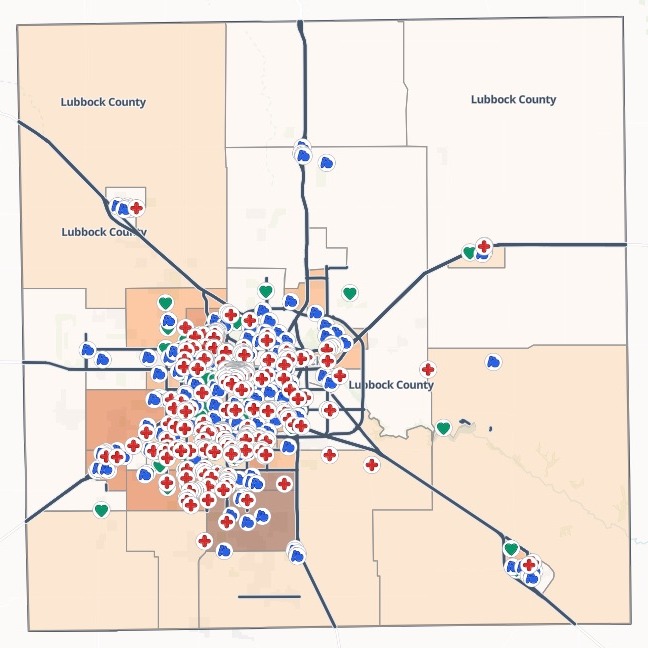
| The layers | Source and release |
|---|---|
| Hospitals, urgent care and clinics | Overture, 2026 |
| K–12 schools | Overture, 2026 |
| Nursing homes and assisted living | Overture, 2026 |
| Main roads | TIGER, 2024 |
| Census tracts, by children under 5 | ACS, 2019–2023 |
| County boundary | TIGERweb, 2024 |
Every layer listed with what it is, how many features it has, its source and its release.
For whoever needs the map before the work starts
A confirmed case.A new project area.
Before anyone can act, someone has to find the boundary, the census figures, the places and the roads, and note where each came from.
That set of layers for one place is a base data package. Writing down the source and release of each layer is its provenance: it lets whoever picks the package up trust it and cite it.
Here you name the place and the layers. Mapstack finds each one, puts them together on one map and writes the list for you.
One real county
A county’s base layers, ready before contact tracing
Lubbock County, Texas, as a city public health team would need it after a confirmed case: the county on one map, before contact tracing and planning vaccination clinics.
- Main roads kept
- 340segments of interstate, US and state highway, from the county's 9,049
- Sources named
- 4each with its year or release, layer by layer
- On one map
- 6 layersfrom one ask, ready to share with the response team
| Places found, from Overture Maps | Places |
|---|---|
| Hospitals, urgent care and clinics | 290 |
| Schools, kindergarten to 12th grade | 150 |
| Nursing homes and assisted living | 64 |
It shades by what the job needs.
Asked for children under 5, it shaded the 106 tracts by them and said why: they are the age group most at risk, and the first in line for vaccination.
U.S. Census Bureau: American Community Survey 5-year estimates, TIGERweb and TIGER/Line roads. Overture Maps Foundation. Fetched by Mapstack. Run on 15 November 2026.
Put the sources on the shared map
Whoever opens the map next week should not have to ask where it came from.
Add a short description to the map's About panel saying what the package is for and the source and release of each layer, so whoever opens the shared map can see where the data came from.
Mapstack wrote it into the map: a paragraph on what the package is for, then each layer with its source and release, and the list of datasets beneath. Anyone who opens the shared map reads it in the side panel.
How it goes
No file needed. Name the place and what goes in the package.
Name the place and the layers.
Mapstack fetches each one and puts them on one map.
Each layer downloads on its own, for whoever works in a GIS.
Take it further
Mapstack offered these next, from the same package.
Around the sites
Attach the places that matter and ask what is within reach.
- Here are the exposure sites. Draw drive-time areas around each one.
Where the gaps are
The areas with the most young children and the furthest to go.
- Find the census tracts with the most children under 5 that are furthest from a clinic.
Common questions
What does it cost?
Free to start. One seat, for you, with a starter amount of work each month. No card.
The package is on the free seat. Every layer, the map, the downloads and a public link.
Seats for the team are paid. One for each person who opens the map privately, charged per person.
The prices are on the pricing page.
What can the team do on the map?
Open an area. Each tract’s total population and children under 5.
Find a place by name. Search for any facility or school.
Read the table, measure a distance. Every layer as a table, and a ruler on the map.
What does it say about the data?
Survey figures are estimates. The tract counts are five-year survey estimates, not a head count, with margins of error, and it says so.
Closed places are left out. Places listed as permanently closed are filtered out.
Gather yours.
Free to start. Seats for your team are paid.